Figures & data
Table 1 Demographic and Clinical Information on the Study Population
Table 2 Comparison of Carotid Atherosclerotic Plaque Detection Between the Two Groups [n (%)]
Table 3 Comparison of Carotid Atherosclerotic Plaque Types Between the Two Groups [n (%)]
Table 4 Comparison of Carotid Plaque Energy Spectrum Parameters Between AIS and Non-AIS Groups (M, IQR)
Table 5 Optimal Diagnostic Thresholds and Diagnostic Efficacy of ROC Curve Analysis of Energy Spectrum Parameters for AIS
Figure 1 ROC curves of carotid plaques leading to the development of AIS as assessed by quantitative parameters (λH, Zeff, ED, and Iodine no water) of spectral CT.
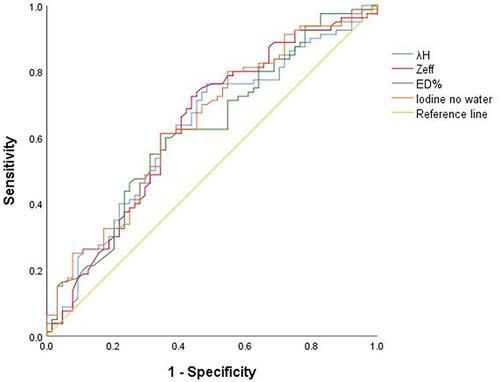
Figure 2 True-false-positive and true-false-negative results for the diagnosis of the subjects of this study using the cut-off values of the energy spectrum curves(λH).
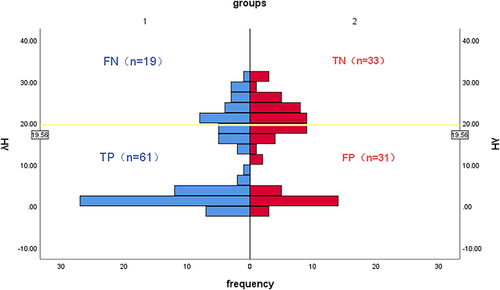
Figure 3 True-false-positive and true-false-negative results for the diagnosis of the subjects of this study using the cut-off values of iodine no water.
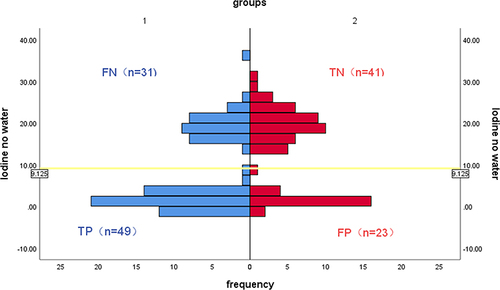
Figure 4 True-false-positive and true-false-negative results for the diagnosis of the subjects of this study using the cut-off values of effective atomic number (Zeff).
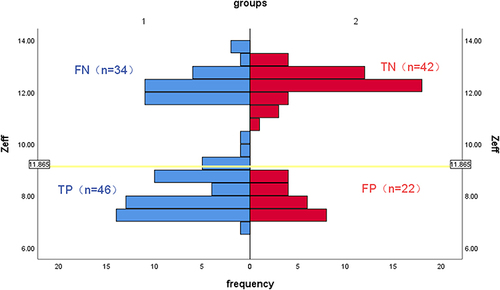
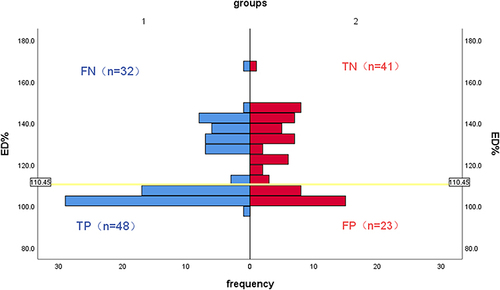
Figure 5 True-false-positive and true-false-negative results for the diagnosis of the subjects of this study using the cut-off values of electron density(ED).