Figures & data
Figure 1 Preparation of Platelet Concentrate using plasma-rich platelet-platelet concentrate (PRP-PC): PRP-PC preparation starts with whole blood centrifugation at light spin (1500 rpm for 5 min at 22°C), removes PRP into a storage bag, then takes the PRP bag and centrifuge it a heavy spin (5000 rpm at four °C). After that, fresh frozen plasma (FFP) is removed into different bags and resuspended to prepare the platelet concentrate for storage.
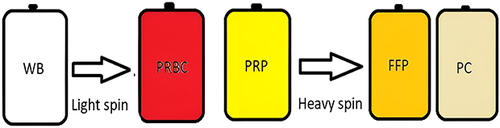
Table 1 Bacterial Detection from Day Five Up to Day Eleven Using the Haemonetics eBDS™ Machine
Figure 2 A statistical analysis of glucose results demonstrates the changes during the days of the experiment; days 5 and 7 show no significant change and are almost typical, while days 9 and 11 present a significant variation in results. ns= no significant, ****: p <0.0001.
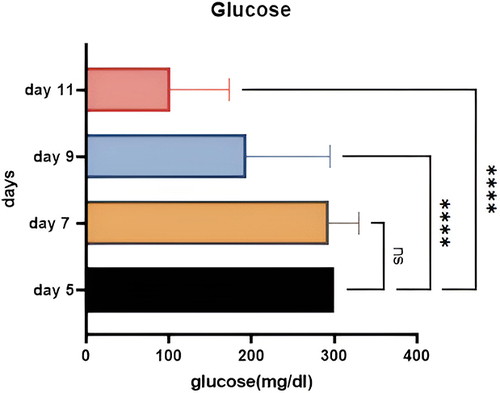
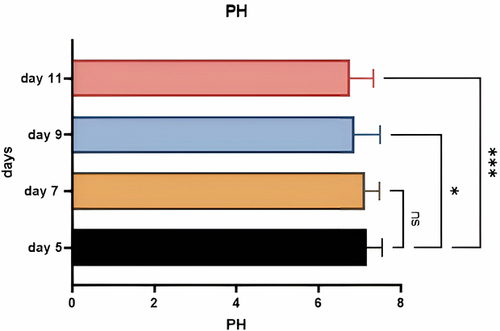
Figure 3 pH results illustrate no significant changes on days 5 and 7; however, the changes were significant on days 9 and 11. ns= no significant difference, (* = 0.033, *** = 0.0002).