Figures & data
Table 1 Clinical Characteristics and Outcomes of All Patients in Mobile Cabin Hospital
Figure 1 Vaccination status and its relevance to symptoms: (a) distribution of days to turn nucleic acid negative, (b) manufacturers and classes of vaccines patients received, and numbers of doses of booster doses, (c) percentage of patients received different doses of vaccination, stratification of age (d) or vaccination (e) due to different numbers of symptoms, and (f) stratification of age due to vaccination status.
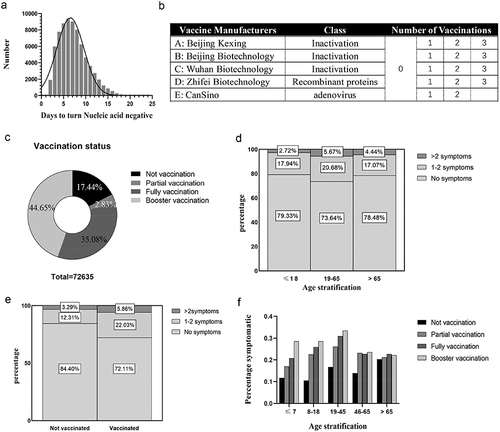
Figure 2 Correlation between days to turn nucleic acid negative and other factors: vaccination status in age stratification (a), symptoms stratification (b and c) and comorbidities stratification (e and f), and symptoms in age stratification (d). *p<0.05, ***p<0.005.
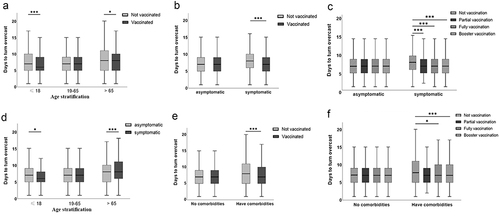
Table 2 Multiple Linear Regression Analysis of Factors Associated with the Duration of COVID-19 PCR Positivity in Asymptomatic and Mild Patients
Figure 3 Kinetics of the ORF1ab Ct value: patients were stratified by Ct value on admission (a), age (b), vaccination status (c), comorbidities (d and f), and symptoms(g and i). *p<0.05, **p<0.01, *** p<0.005.
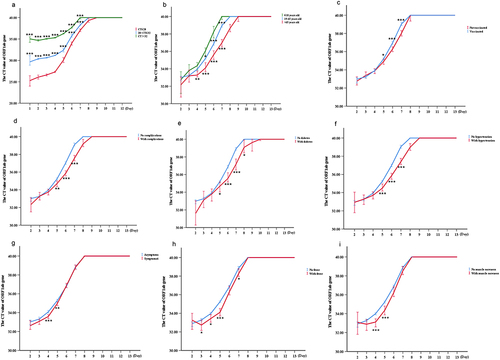
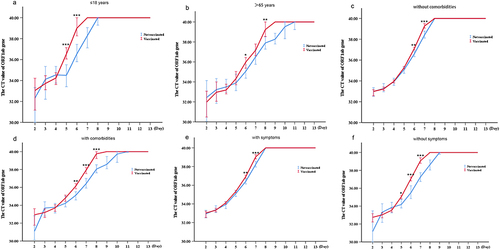
Figure 4 Different kinetics of ORF1ab Ct value in patients with different vaccination status: patients were stratified according to age (a and b), comorbidities (c and d), and symptoms (e and f). *p<0.05, **p<0.01, ***p<0.005.