Figures & data
Table 1 The Characteristics of Establishment of the LDLC Equation Group
Table 2 Instrument Performance Parameters (TG, TC, HDL-C, and LDL-C) of AU5821 Chemistry Analyzer
Figure 1 The characteristics of the participants included in the construction of the novel LDLC equations.
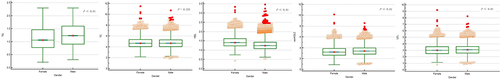
Figure 2 We obtained two novel LDLC equations.
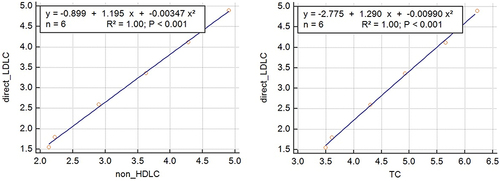
Figure 3 The histogram of the characteristics of the unselected patient cohort.
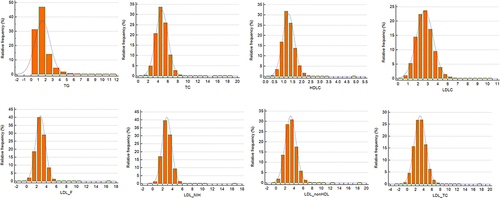
Figure 4 Scatter plots for the direct low-density lipoprotein cholesterol (LDLC) and LDLC equations. Their relationship was analysed using Spearman’s approach.
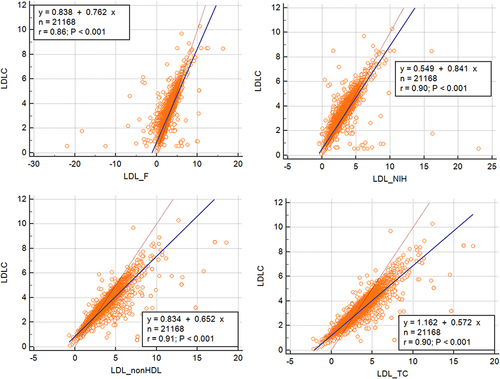
Figure 5 Receiver operating characteristic curves of the LDLC equations for predicting direct low-density lipoprotein cholesterol (direct LDLC levels are >1.55 mmol/L, >1.80 mmol/L, >2.60 mmol/L, >3.36 mmol/L, >4.12 mmol/L, and >4.90 mmol/L).
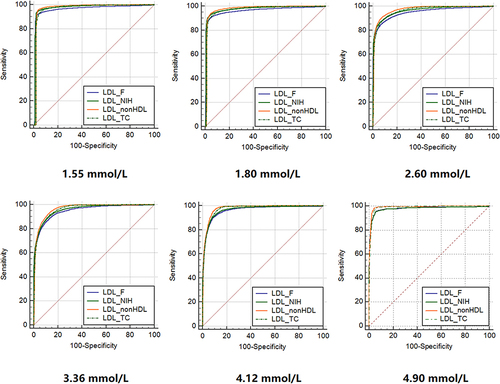
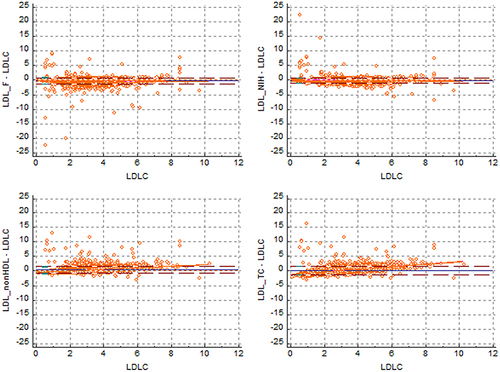
Figure 6 Bland‒Altman plot of LDLC from four LDLC equations.