
Figures & data
Figure 1 Flow chart.
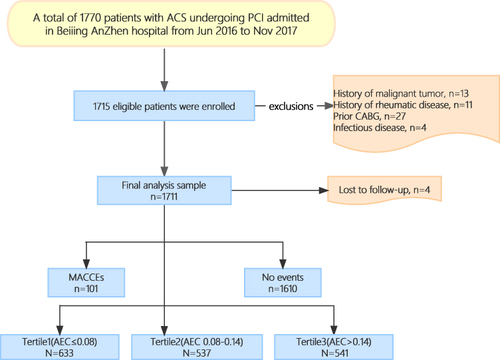
Table 1 Baseline Clinical and Laboratory Characteristics of the Study Patients According to the AEC Tertiles
Table 2 Discharge Medications, Angiographic Findings and Procedural Results of the Study Patients According to the AEC Index Tertiles
Table 3 Adverse Cardiovascular Events According to AEC Tertiles During Follow-Up
Figure 2 The AEC index and risk: Kaplan–Meier curves for the incidences of the primary endpoint (a), cardiovascular death (b), non-fatal stroke (c), non-fatal myocardial infarction (d) among the 3 study groups based on the AEC index tertiles.
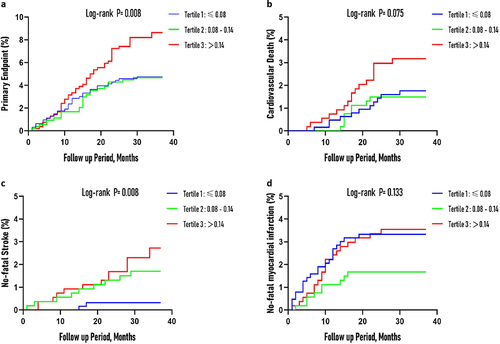
Table 4 Relationship Between the Incidence of the Primary Endpoint and the AEC Index Expressed as a Categorical Variable
Figure 3 Risk of cardiovascular death, non-fatal stroke or non-fatal myocardial infarction, according to tertiles of the AEC index. Error bars indicate 95% confidence intervals. The first tertile is the reference. (a) Univariate relationship. (b) Relationship adjusted for age, sex, SYNTAX II score, hs-CRP, never smoking, hypertension, diabetes, presence of cardiac failure, PAD, past PCI, previous MI and complete revascularization.
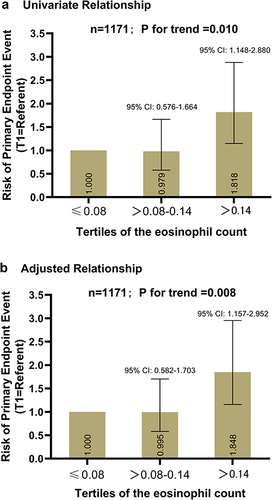
Table 5 Relationship Between the Incidence of the Primary Endpoint and Comorbidities, Medicines and ACS Subtypes
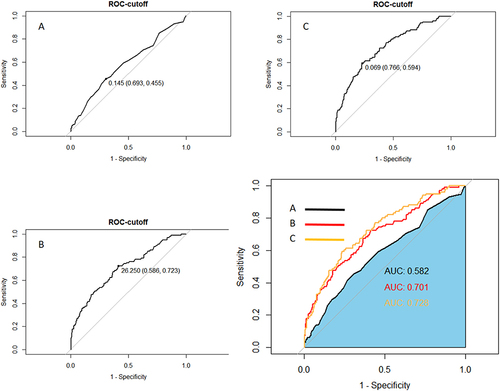
Figure 4 ROC analysis showing the cut-off values of AEC (A), SYNTAX II score (B) and the adjustment of SYNTAX II Score by AEC (C) to predict the primary endpoint. The primary endpoint was defined as a composite of cardiovascular death, no-fatal MI or stroke, and the individual components of them.
Data Sharing Statement
The unadjusted data that underlies the findings of this article will be accessible by the authors, free from any undue constraints.