Figures & data
Figure 1 The patients’ selection of the study.
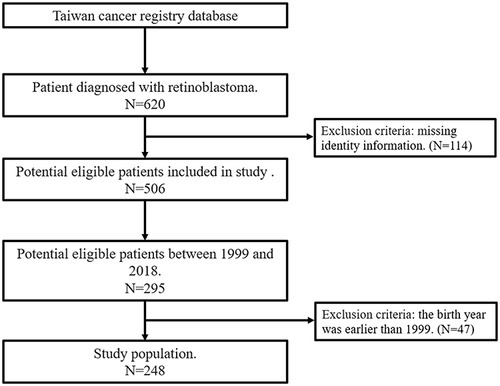
Table 1 Demographic Information of Retinoblastoma in Taiwan During 1999 to 2018, Total Candidate Participants
Figure 2 Number of cases and ratio between sex by diagnostic age in Taiwan during 1999 to 2018, total candidate participants.
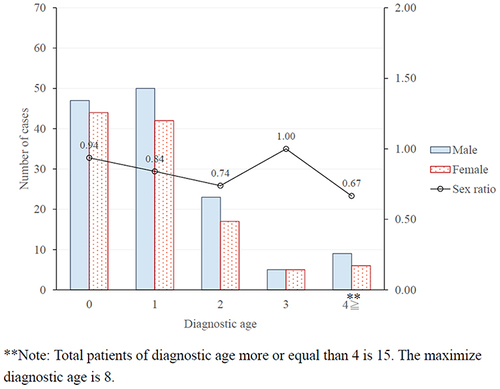
Table 2 Incidence of Retinoblastoma in Taiwan During 1999 to 2018, Total Candidate Participants (N = 248)
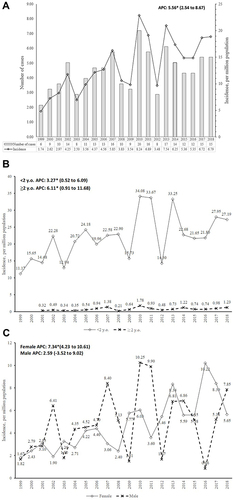
Figure 3 Incidence Trend of Retinoblastoma from 1999 to 2018. (A). Overall; (B). different age population; (C). different sex population; *p<0.05.