Figures & data
Figure 1 Changes in the number of male and female finishers across the years.
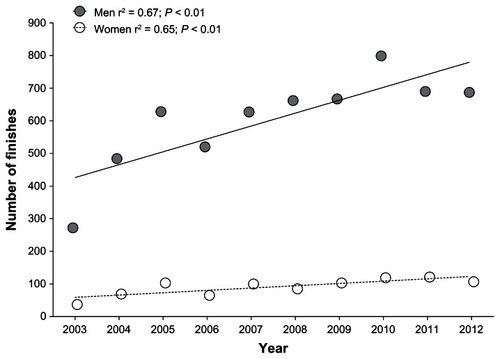
Figure 2 Total numbers of male and female finishers per age group during the investigated 10-year period.
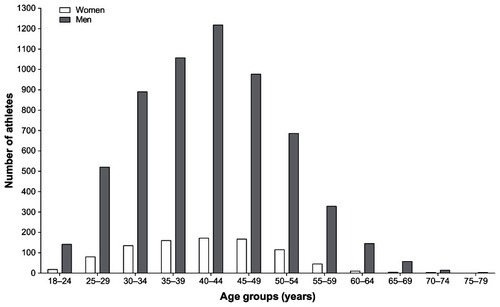
Figure 3 Change in the number of finishes per age group during the study period for women (A) and men (B).
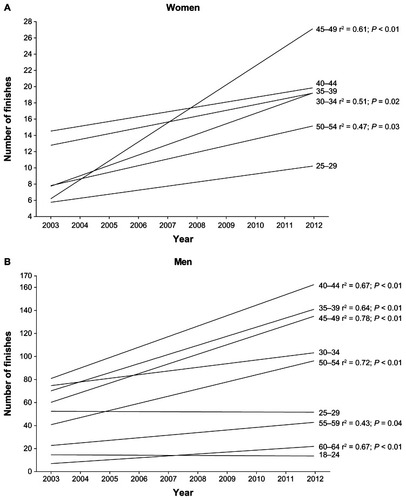
Table 1 Change in the number of female and male finishers per age group
Figure 4 Changes in the mean age of all male and female finishers during the study period.
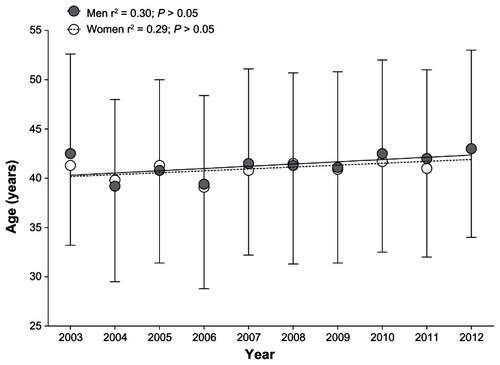
Figure 5 Changes in the mean age of the annual top 25 male and female finishers during the study period.
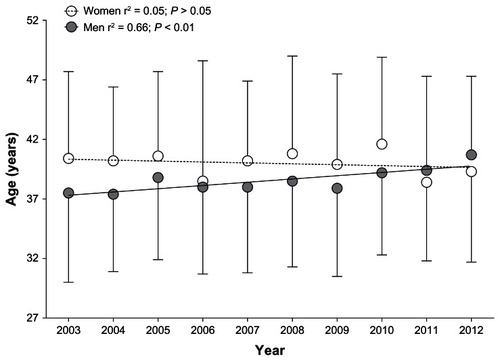
Figure 6 Changes in running speed of the top five athletes per age group for women (A) and for men (B).
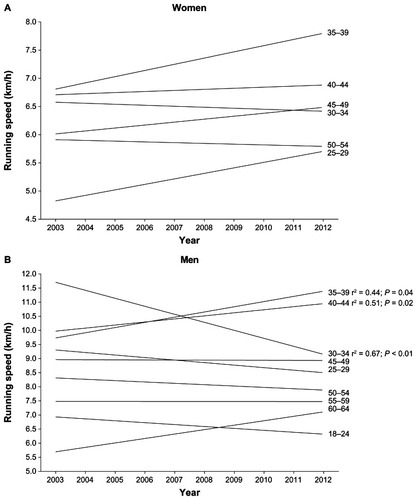
Table 2 Change in running speed of female and male finishers per age group
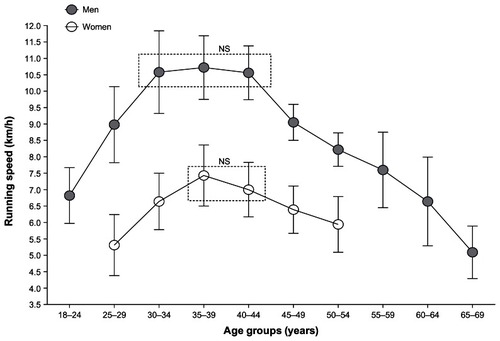
Figure 7 Mean (±SD) performance of the best 25 male and female finishers per age group during the 2003–2012 period.
Abbreviations: SD, standard deviation; NS, not significant.