
Figures & data
Figure 1 Functional lateral radiographs and magnetic resonance imaging. (A and B). Translation greater than 3 mm or changes in angulation greater than 9° subtended between solid lines on the lateral flexion and extension standing radiographs were considered to show segmental instability. C. To measure the height of the spinous process (anterior arrow), a line parallel to the posterior wall of the vertebral body (dotted line) was drawn first and the maximum length among all the slice lengths was obtained. Inter-spinous process distance (posterior arrow) was defined as the distance between midpoints of the spinous processes.
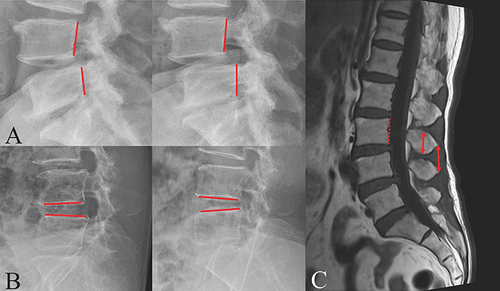
Figure 2 The components of the posterior ligament complex (white arrow) were classified into a 4-grade category according to the modified Fujiwara’s criteria described by Kong. (A). Type 1 (low intensity on both T1- and T2-weighted images without hypertrophy of the spinous process); (B). Type 2 (low intensity on T1-weighted and high intensity on T2-weighted images); (C). Type 3 (high intensity on T1- and intermediate to high intensity on T2-weighted images); (D). Type 4 (low intensity on both T1- and T2-weighted images with hypertrophy of the spinous process, mixed signal or same signal pattern).
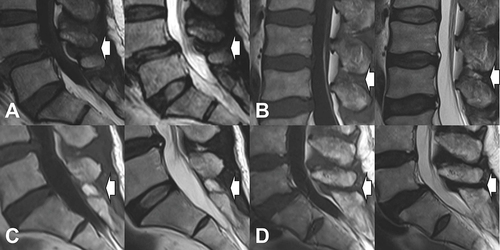
Table 1 Demographic Data of 2 Groups. BMI, Body Mass Index
Table 2 Abnormal Segmental Motion Stratified by Patient Age
Table 3 Comparative Results of MRI Findings in Patients with or Without Lumbar Instability
Table 4 Comparative Results of MRI Findings in Different Types of Motion
Table 5 Height of Spinous Process and Interspinous Distance Between Two Groups