
Figures & data
Figure 1 Clear Cell Renal Cell Carcinoma. 47-year-old male. (a) Non-contrast axial CT scan, with a mass in the upper pole of the Lt Kidney. Mean HU=16.15. (b) Post-contrast nephrogenic phase axial CT scan with the mass in the upper pole of the Lt Kidney. Mean HU= 63.74.
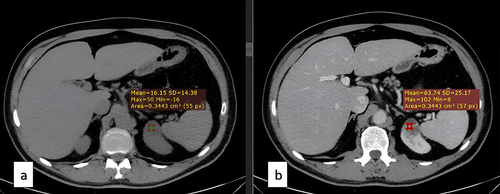
Table 1 Illustration for Demographics, Smoking Status, Tumor Size, Grades and HU in Pre-Contrast and Nephrogenic Phase
Table 2 Different Variables and Their P values