
Figures & data
Figure 1 Maternal age at conception of DS patients on follow up at TASH.
Explanations: Color Labels: to show distribution of maternal age at conception.
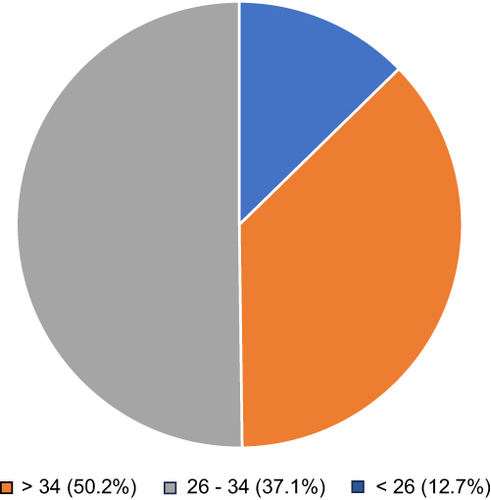
Table 1 Congenital Cardiac Anomaly Phenotypes Among DS Patients on Follow-Up at TASH
Figure 2 Distribution of congenital anomalies among DS patients on follow-up at TASH.
Explanations: X-axis shows types of congenital anomalies diagnosed among DS patients. Y-axis shows percentage of the congenital anomalies diagnosed. Types of congenital anomalies. Cardiac Anomalies (67.3%). HEENT (Head, Eye, Ear, Nose, and throat) Anomalies (8%). GUS (Genito-urinary System) Anomalies (6.4%). GI (Gastro-intestinal) Anomalies (5.2%). RS (Respiratory System) Anomalies (1%). Limb Anomalies (1%).
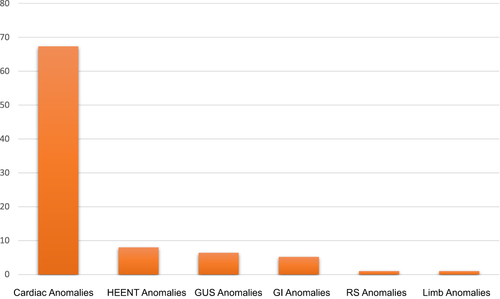
Figure 3 Types of VSD cases diagnosed among DS patients on follow-up at TASH.
Explanations: Color Labels: to show different types of ventricular septal defect cases.
Note: Others include mixed muscular with perimembranous and Swiss cheese type VSD.
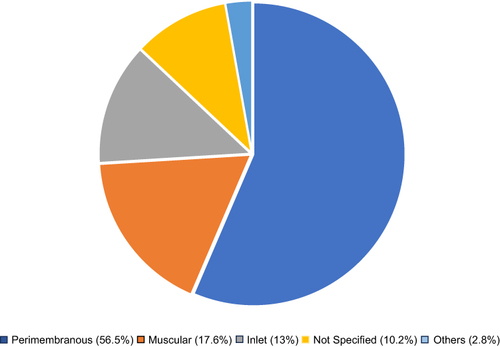
Table 2 Congenital GUS Anomalies Among DS Patients on Follow-Up at TASH
Table 3 Congenital GI Anomalies Among DS Patients on Follow-Up at TASH
Table 4 Logistic Regression Analysis of Predictive Factors for Development of Cardiac Congenital Anomalies Among DS Patients on Follow-Up at TASH