Figures & data
Table 1 Summary of Those Four GEO Datasets Involving as and is Patients
Figure 1 The workflow chart of the study.
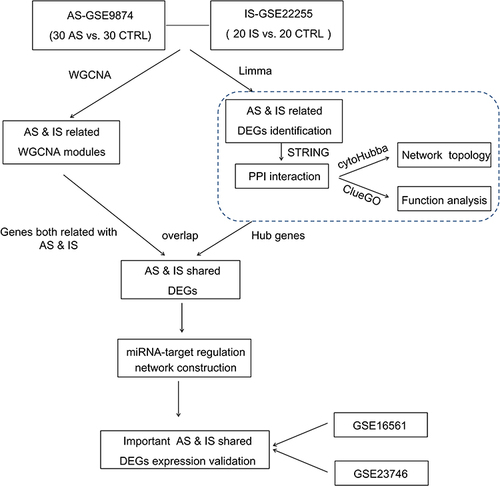
Table 2 Primers Used for RT-PCR in This Study
Figure 2 (A). Left: The cluster dendrogram of co-expression genes in GSE22255 (IS). Right: Module–trait relationships in IS. Each cell contains the corresponding correlation and p-value. (B) Left: The cluster dendrogram of co-expression genes in GSE9874 (AS). Right: Module–trait relationships in IS. Each cell contains the corresponding correlation and p-value.
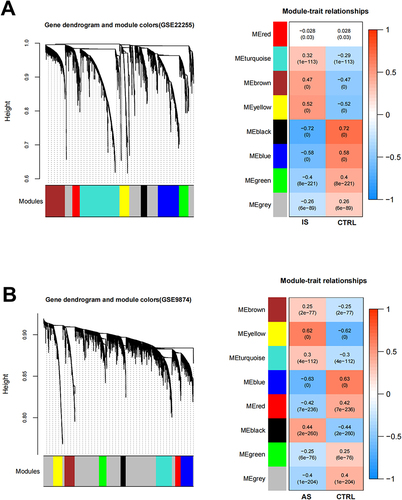
Figure 3 The shared genes between Positive (A) and Negative (B) modules in AS and IS.
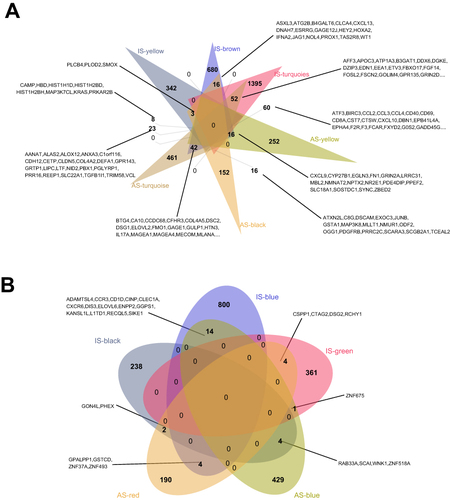
Figure 4 The DEGs of GSE9874 (A) and GSE22255 (B). The blue and red dots represent DEGs filtered based on the cutoff criteria of adjusted |log2 (fold change)| >0.5 and FDR < 0.05, While the grey dots represent genes that do not satisfy the cutoff criteria.
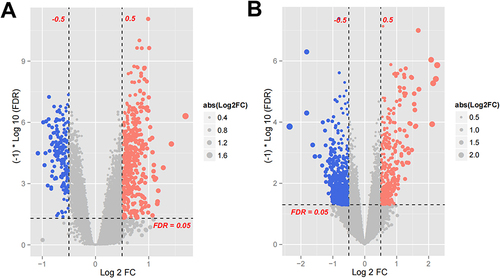
Figure 5 Comparison Venn of DEGs in AS and IS. The graph on the left shows up-regulated genes and the graph on the right shows down-regulated genes.
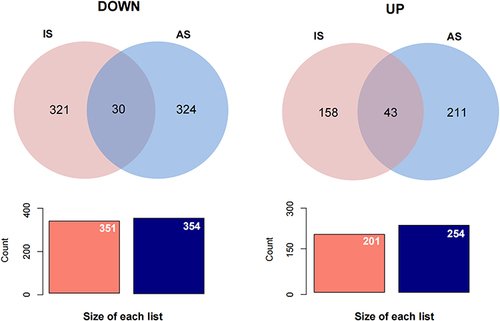
Figure 6 PPI network of shared DEGs.Green and pink nodes represent downregulated and upregulated shared DEGs.
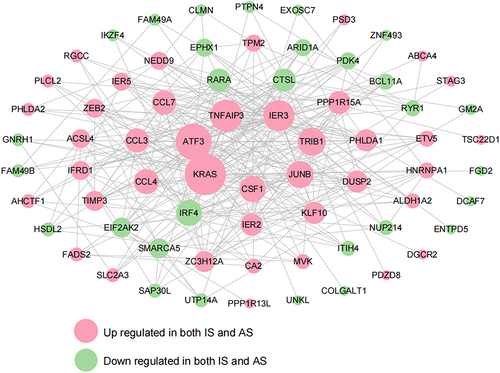
Figure 7 The interaction network of GO terms generated by the Cytoscape plug-in ClueGO and the significant term of each group is highlighted; Proportion of each GO terms group in the total.
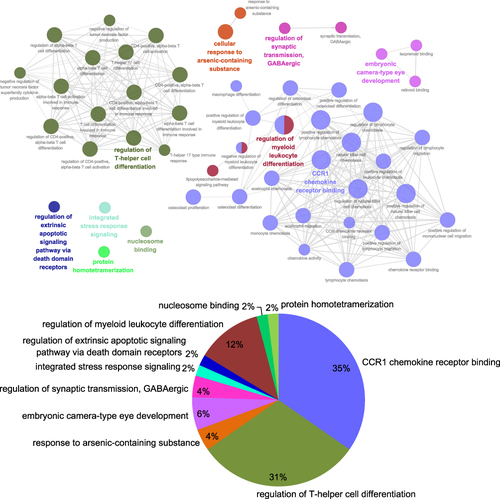
Figure 8 Venn display of top 20 genes based on Degree, MCC (Maximal Clique Centrality), MNC (Maximum Neighborhood Component), EPC (Edge Percolated Component).
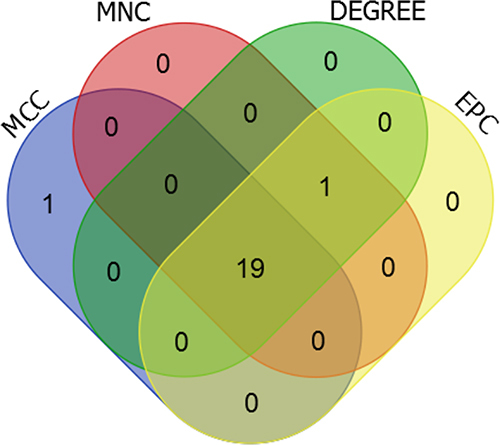
Figure 9 miRNA-6 hub genes-KEGG pathway network. Red, yellow nodes represent 6 DEGs and related miRNAs, blue and green nodes represent 6 genes related to KEGG and overlapped 9 KEGG pathways; the Green line represents miRNA-KEGG, the grey line represents miRNA-DEGs, the red line represents KRAS- overlapped 9 KEGG pathways.
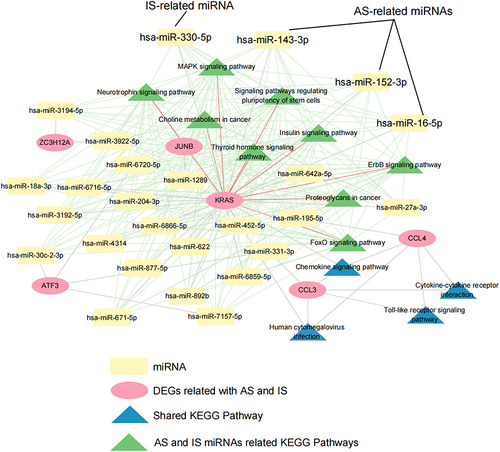
Figure 10 miRNA-KRAS-KEGG pathway network. Red, yellow nodes represent KRAS and AS or IS-related miRNAs, green nodes represent overlapped KEGG pathways; the Green line represents miRNA-KEGG, the grey line represents miRNA-DEGs, the red line represents KRAS- overlapped 9 KEGG pathways.
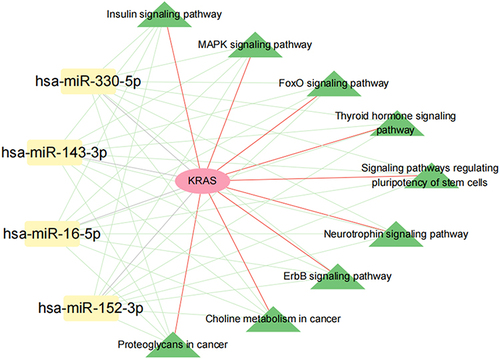
Table 3 Clinical Features of in vivo Validation
Figure 11 Six hub genes expression levels in IS-related datasets (GSE22255 and GSE16561) (A) and AS-related datasets (GSE9874 and GSE23746) (B). * p<0.05, ** p<0.01, ***p<0.001.
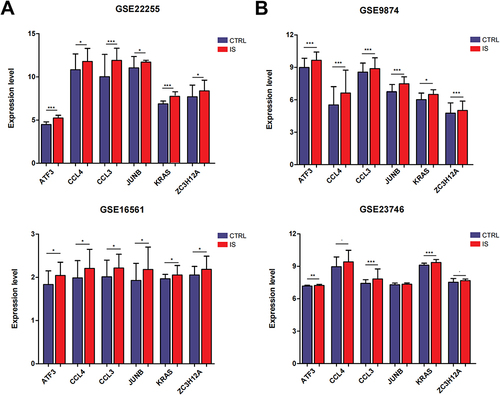
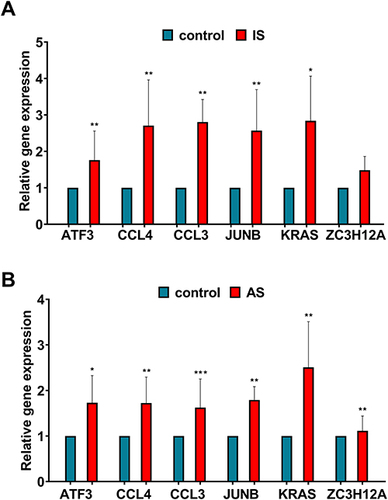
Figure 12 In vivo verification Relative Expression. Levels of Hub Genes in Patients Clinically Diagnosed with IS (A) and AS (B). * p<0.05, ** p<0.01, ***p<0.001.