Figures & data
Table 1 Baseline Characteristics of AIS Patients Received Early Intravenous Thrombolysis Treatment
Figure 1 Flow chart.
Abbreviations: AIS, acute ischemic stroke; mRS, modified Rankin scale.
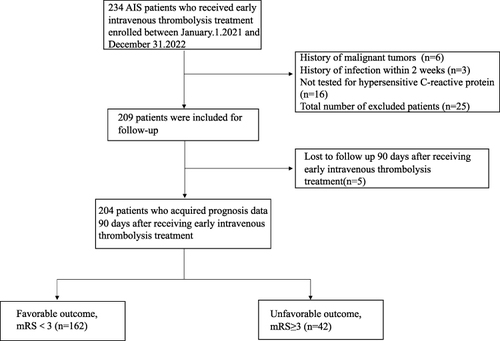
Figure 2 Violet plot of C-NLR and C-LMR.
Abbreviations: C-NLR, CRP/neutrophil-to-lymphocyte ratio; C-LMR, CRP×lymphocyte-to-monocyte ratio.
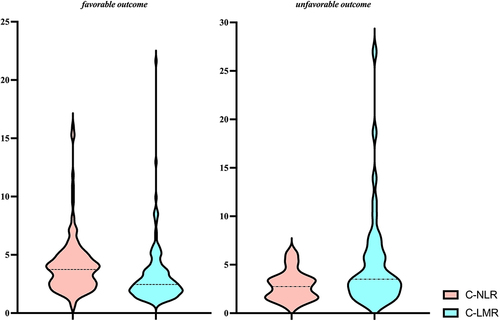
Table 2 Univariate and Multivariate Logistic Regression of NLR, LMR, CRP, C-NLR, C-LMR
Figure 3 Univariate and multivariate logistic regression analysis forest plots for NLR, LMR, CRP, C-NLR, C-LMR.
Notes: 95% Confidence Interval of univariate analysis: NLR, 1.060~1.324; LMR, 0.524~0.864; CRP, 1.013~1.071; C-NLR, 1.034~1.268; C-LMR, 1.006~1.034. 95% Confidence Interval of multivariate analysis: NLR, 0.877~1.191; LMR, 0.588~1.488; CRP, 0.996~1.101; C-NLR, 1.098~2.291; C-LMR, 1.025~1.179.
Abbreviations: NLR, neutrophil-to-lymphocyte ratio; LMR, lymphocyte-to-monocyte ratio; CRP, high sensitivity C-reactive protein; C-NLR, CRP/neutrophil-to-lymphocyte ratio; C-LMR, CRP×lymphocyte-to-monocyte ratio.
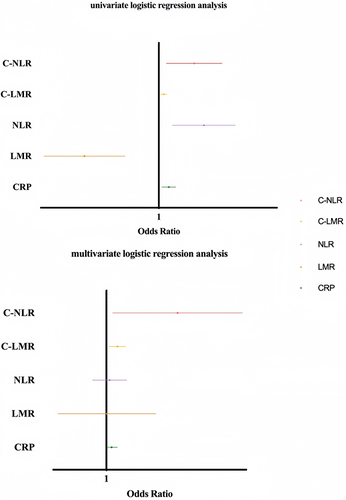
Figure 4 Receiver operating characteristic(ROC) curve of C-NLR, C-LMR.
Abbreviations: C-NLR, CRP/neutrophil-to-lymphocyte ratio; C-LMR, CRP×lymphocyte-to-monocyte ratio.
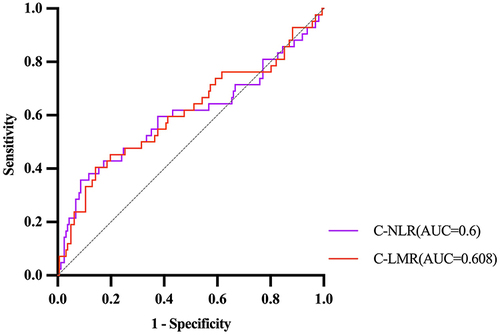
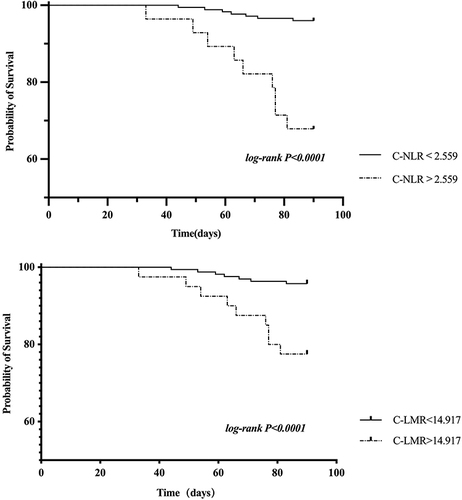
Figure 5 Kaplan-Meier survival curve of C-NLR and C-LMR.
Notes: log-rank<0.05 was considered statistically significant.
Abbreviations: C-NLR, CRP/neutrophil-to-lymphocyte ratio; C-LMR, CRP×lymphocyte-to-monocyte ratio.