
Figures & data
Table 1 Characteristics of Chinese Breast Cancer Patients
Figure 1 Flowchart shows participants in this study.
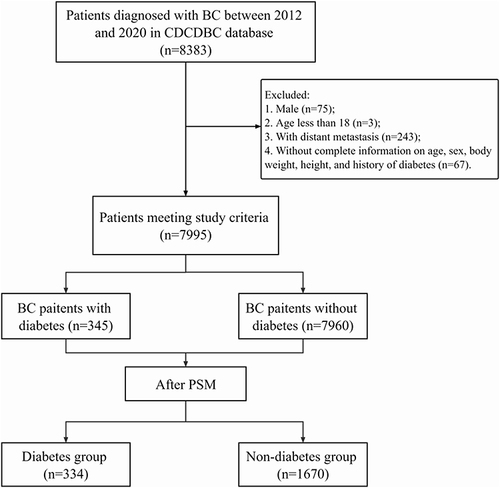
Figure 2 Changes in plasma glucose (A) and insulin (B) concentrations during the OGTT and IRT in Chinese breast cancer women with NGT (red), prediabetes (blue) and NDD (black), respectively. Plasma glucose (C) and insulin (D) concentrations for different insulin patterns in the NGT, prediabetes, and NDD groups, respectively. Indices for β-cell function (E) and insulin sensitivity (F) during the OGTT in Chinese breast cancer women with NGT, prediabetes and NDD, respectively. NGT1: NGT patients with a peak of insulin during an IRT at 30 or 60 min; NGT2: NGT patients with peak of insulin at 120 min; Prediabetes1: prediabetes patients with peak of insulin at 30 or 60 min; Prediabetes2: prediabetes patients with peak of insulin at 120 min; NDD1: NDD patients with peak of insulin at 30 or 60 min; NDD2: NDD patients with peak of insulin at 120 min.
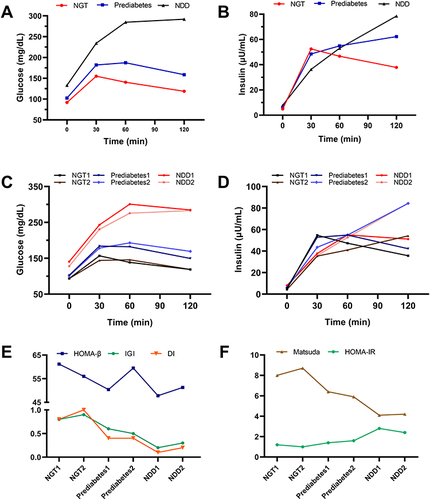
Table 2 Characteristics of Chinese Breast Cancer Patients Stratified by the Time of Peak Insulin Secretion
Table 3 Sensitivity, Specificity, Positive Predictive Value, Negative Predictive Value, Positive Likelihood Ratio, Negative Likelihood Ratio, and Youden’s Index of HbA1c Cutoff Values for Diabetes
Table 4 Sensitivity, Specificity, Positive Predictive Value, Negative Predictive Value, Positive Likelihood Ratio, Negative Likelihood Ratio, and Youden’s Index of HbA1c Cutoff Values for Prediabetes
Figure 3 (A) ROC curve analysis of the performance of HbA1c in predicting diabetes in Chinese women with breast cancer. The AUC was 0.903 (P<0.001, 95% CI, 0.867–0.938). For cutoff point of HbA1c≥6.0%, the sensitivity was 78.1%, and the specificity was 76.9%. (B) ROC curve analysis of the performance of HbA1c in predicting prediabetes in Chinese women with breast cancer. The AUC was 0.703 (P<0.001, 95% CI, 0.632–0.774). For cutoff point of HbA1c≥5.5%, the sensitivity was 76.9%, and the specificity was 51.8%. 5.5%: HbA1c cutoff point for prediabetes found in this study. 5.7%: HbA1c cutoff point for prediabetes recommended by ADA. 6.0%: HbA1c cutoff point for diabetes found in this study. 6.5%: HbA1c cutoff point for diabetes recommended by the ADA.
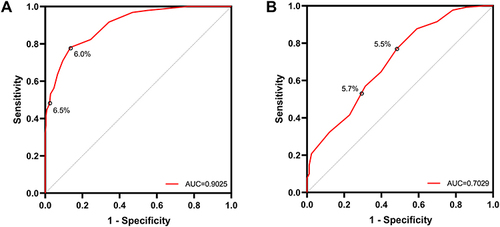
Table 5 Agreement Between HbA1c and Glucose Criteria by ADA and Our Research
Table 6 The Cutoff Points of HbA1c for Diagnosing Diabetes and Prediabetes in Different Subgroups
Data Sharing Statement
The datasets used in this study are available on request from the corresponding author.