Figures & data
Table 1 Baseline Characteristics of the Study Cohort
Table 2 Medication After Discharge
Figure 1 Study population flow chart.
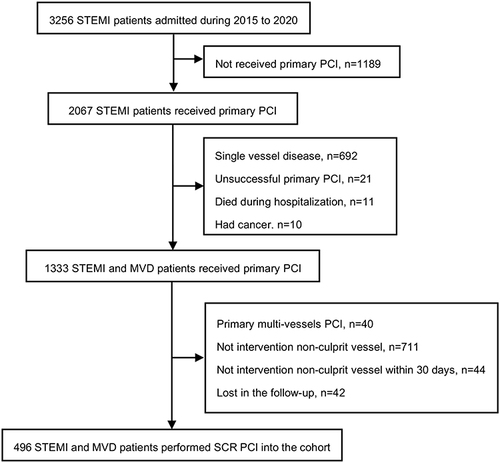
Table 3 The Characteristics of the Variables in the MACE Prediction Model
Table 4 The Characteristics of the Variables in the All-Death Prediction Model
Figure 2 MACE-free survival probabilities. Calibration plots of MACE-free survival probabilities at 1 year (A) and 3 years (B). Nomogram-predicted MACE-free survival is plotted on the x-axis, with observed MACE-free survival on the y-axis. Dashed lines along the diagonal line through the origin point represent the perfect calibration models in which the predicted probabilities are identical to the observed probabilities. (C) Nomogram for predicting the probability of MACE-free survival at 1 year and 3 years. The presence or absence of each clinical characteristic indicates a certain number of points. The number of points for each clinical characteristic is in the top row. For each characteristic, absence is assigned 0 points. The presence of characteristics is associated with a number of points generated using the nomogram function rms package in R based on the results of LASSO analysis. The points for each characteristic are summed to generate a total-points score. The total points correspond to the respective 1-year and 3-year MACE-free survival probabilities.
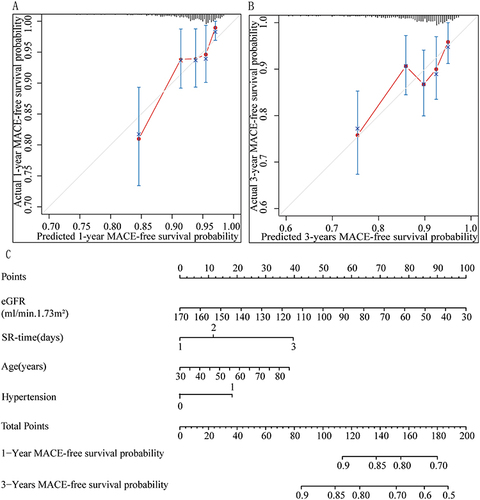
Figure 3 Total survival probabilities. Calibration plots of total survival probabilities at 1 year (A) and 3 years (B). Nomogram-predicted total survival is plotted on the x-axis, with observed total survival on the y-axis. Dashed lines along the diagonal line through the origin point represent the perfect calibration models in which the predicted probabilities are identical to the observed probabilities. (C) Nomogram for predicting the probability of total survival at 1 year and 3 years. The presence or absence of each clinical characteristic indicates a certain number of points. The number of points for each clinical characteristic is in the top row. For each characteristic, absence is assigned 0 points. The presence of characteristics is associated with a number of points generated using the nomogram function rms package in R based on the results of LASSO analysis. The points for each characteristic are summed to generate a total-points score. The total points correspond to the respective 1-year and 3-year total survival probabilities.
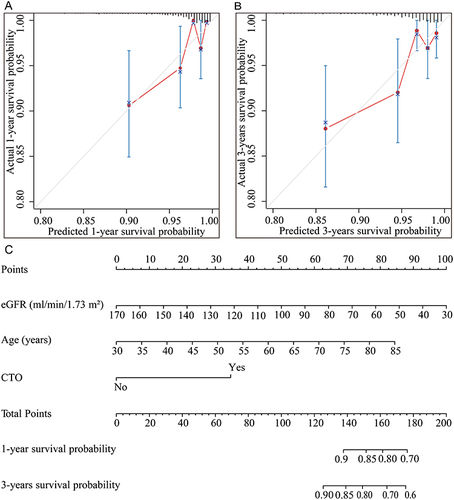
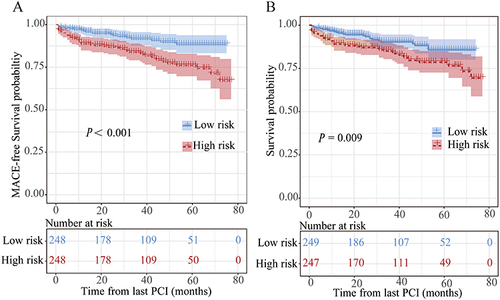
Figure 4 Survival curves by different risk groups. MACE-free survival curves (A) and overall survival curves (B), stratified into low-risk and high-risk groups by the median of the risk scores from the nomograms above.