
Figures & data
Table 1 Baseline Characteristics of the Study Population
Figure 1 Study flowchart.
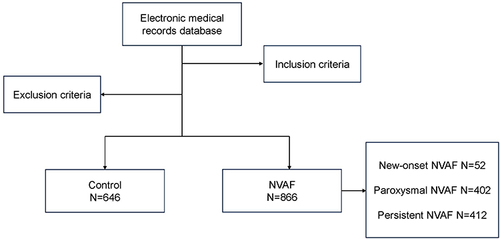
Figure 2 SUA levels in the NVAF group and the control group. (A) There were significant differences in SUA levels between the NVAF group and the control group (5.75 (2.50) vs 4.89 (1.65) mg/dL, P<0.001). (B) There were significant differences in SUA levels between the NVAF group and the control group by gender (male, 6.08 (2.40) vs 5.30 (1.73) mg/dL, P<0.001; female, 5.29 (2.45) vs 4.39 (1.68) mg/dL, P<0.001).
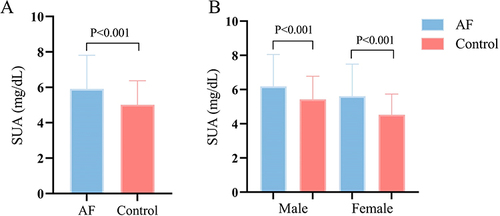
Figure 3 Influencing factors associated with SUA levels in NVAF patients. (A) Correlation of SUA levels with Scr (r=0.463, P<0.001). (B) Correlation of SUA levels with NT-proBNP (r=0.265, P<0.001). (C) Correlation of SUA levels with APOA1 (r=−0.179, P<0.001).
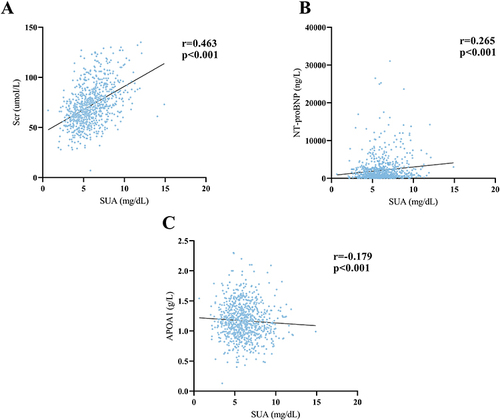
Table 2 Association of SUA with NVAF by Logistic Regression
Table 3 Correlation of SUA Levels with Subtypes of NVAF
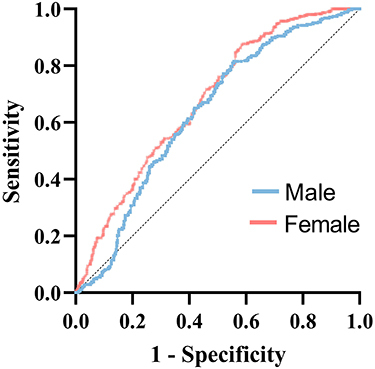
Figure 4 The ROC curve analysis of SUA and NVAF. The purple curve was for male NVAF patients, the area under the ROC curve was 0.63 (95% CI 0.60–0.67, P < 0.001), and the optimal cut-off point was 6.37 mg/dL. The Orange curve was for female NVAF patients, the area under the ROC curve was 0.68 (95% CI 0.64–0.72, P < 0.001), and the optimal cut-off point was 5.72 mg/dL.
Data Sharing Statement
The datasets used and analysed during the current study are available from the corresponding author on reasonable request.