Figures & data
Table 1 Baseline Demographics and Clinical Characteristics According to Myocardial Injury
Table 2 Baseline Demographics and Clinical Characteristics According to Survival
Figure 1 Cardiac troponin values and odds ratio of mortality.
Notes: Distribution of hs-cTnT values in patients was colored in blue. Spline curve of the odds ratio of in-hospital death was plotted according to the values of hs-cTnT. Dashed black lines are 95% confidence intervals. Dashed grey line indicates odds ratio = 1.
Abbreviation: hs-cTnT, high-sensitivity cardiac troponin T.
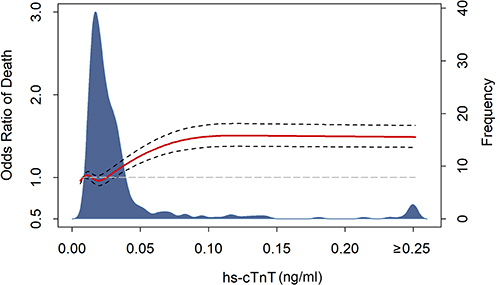
Figure 2 Temporal changes in cycle threshold values from admission.
Notes: Figure shows temporal changes in Ct values of SARS-CoV-2 between patients with and without myocardial injury. Ct values in the y axis were the average of simultaneously tested Ct values of ORF1ab and N since they were parallel and approximate. 95% confidence interval was indicated by the ribbon.
Abbreviations: Ct, cycle threshold; ORF1ab, open reading frame 1ab; N, nucleocapsid protein.
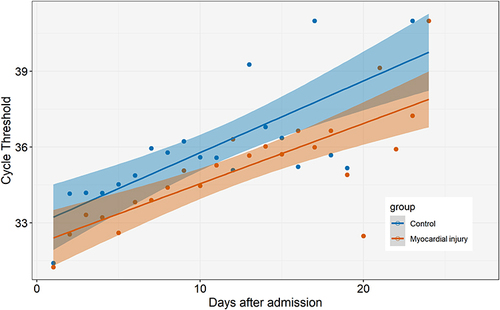
Figure 3 Odds ratio of risk factors of myocardial injury.
Notes: Multivariate model was adjusted with age (per 5-year increase), hypertension, diabetes, coronary artery disease, severity of COVID-19, vaccination, creatinine, D-dimer and neutrophil-to-lymphocyte ratio.
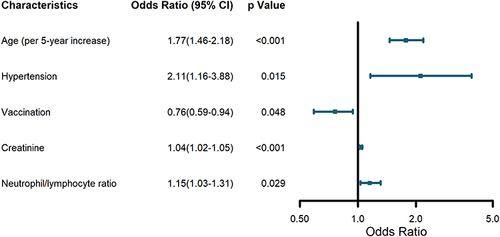
Table 3 Predictors of Mortality in Multivariate Logistic Regression Models
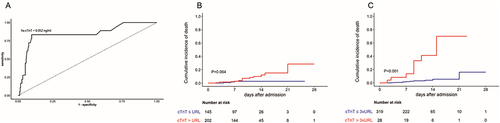
Figure 4 Hs-cTnT and clinical endpoints.
Notes: (A) Receiver operating characteristic curve of hs-cTnT for the prediction of mortality. hs-cTnT = 0.052 ng/mL (3 × URL) had most balanced sensitivity and specificity. (B) The cumulative incidence of in-hospital mortality in patients with hs-cTnT > URL and those who did not. (C) The cumulative incidence of in-hospital mortality in patients with hs-cTnT > 3 × URL and those who did not.
Abbreviations: hs-cTnT, high-sensitivity cardiac troponin T; URL, upper reference limit.