
Figures & data
Table 1 Clinical Characteristics of AP Patients in the Early Stage
Table 2 The GI Injury in Different Severe of AP Patients
Figure 1 Serum HDC, DAO and MMP8 levels in healthy controls and patients in each group. (A) Serum DAO, HDC, and MMP8 levels were significantly higher in AP patients than in healthy controls. (B) Serum levels of DAO, HDC, and MMP8 were higher in GI injury patients than in non-GI injury patients.
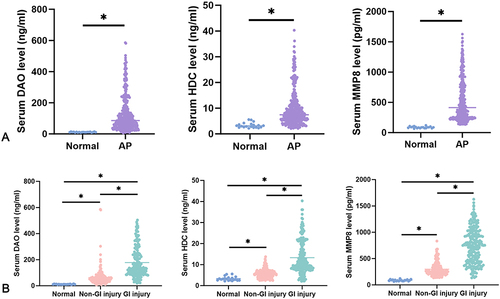
Table 3 Serum HDC, DAO, and MMP8 Levels in AP Patients with Different AGI Class
Table 4 The Intestinal Score, Serum HDC, DAO, and MMP8 Levels in AP Rats
Figure 2 Pancreas and intestinal injury in AP rats. (A–C) Edema, hemorrhage, inflammation, and necrosis were observed in the pancreas in the AP group. (D–F) Edema, hemorrhage, loss in the apex of the villus, massive epithelial lifting down the sides of villi, and chyladenectasis were detected in the AP group.
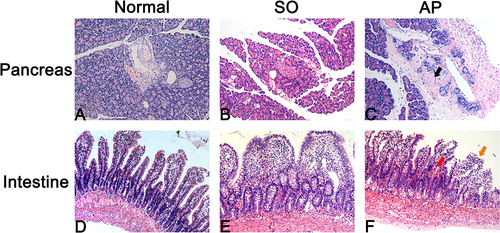
Figure 3 Serum DAO, HDC, and MMP8 levels and tight junction protein expression in AP rats. (A–C) Serum DAO, HDC, and MMP8 levels were higher in the AP group than in the normal group and SO group at the same point of time. (D) Western blot for tricellulin, claudin-1, ZO-1, and occludin in the intestinal mucosa of rats. (E–H) The expression of tricellulin, claudin-1, ZO-1, and occludin was significantly decreased in the AP group than in the normal group and SO group.
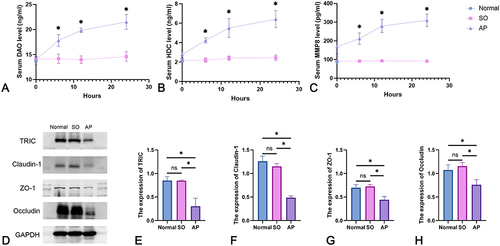
Figure 4 Prediction of GI injury using ROC of serum HDC, DAO, and MMP8 levels. The areas under the ROCs of DAO, HDC, and MMP8 were 0.879 [95% CI (0.844, 0.915)], 0.854 [95% CI (0.815, 0.894)], and 0.898 [95% CI (0.867, 0.929)], respectively.
![Figure 4 Prediction of GI injury using ROC of serum HDC, DAO, and MMP8 levels. The areas under the ROCs of DAO, HDC, and MMP8 were 0.879 [95% CI (0.844, 0.915)], 0.854 [95% CI (0.815, 0.894)], and 0.898 [95% CI (0.867, 0.929)], respectively.](/cms/asset/316707b6-43e7-4e80-a8c3-bb5f8c00d30b/dijg_a_12302521_f0004_c.jpg)