
Figures & data
Figure 1 SEPT3 is identified as a disease marker in TNBC. (A–C) Volcano plots represent the differential genes between TNBC and normal samples based on GSE76250, GSE38959 and TCGA datasets. (D) Venn diagram demonstrates the intersections of genes among three datasets. (E) Forest plot shows that differentially expressed genes associated with TNBC prognosis, SEPT3 is closely related to the prognosis of patients with TNBC.
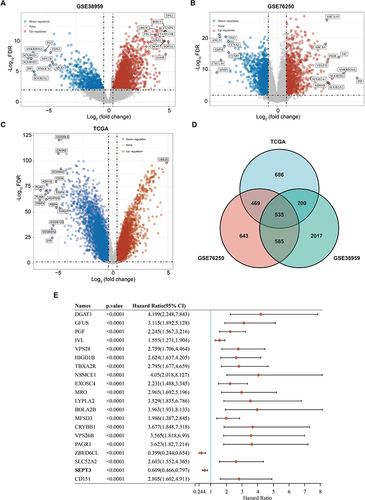
Figure 2 SEPT3 can be used as independent prognostic factor for TNBC patients. (A) Differences in the expression of SEPT3 between normal and tumor tissues based on three datasets. (B) Kaplan-Meier survival curves of TNBC patients stratified by high and low expression of SEPT3. (C) Univariate Cox regression analysis. (D) Multivariate Cox regression result.
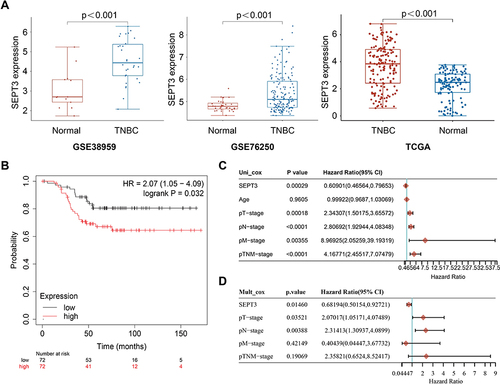
Table 1 Association Between SEPT3 Expression and Clinical Features of Patients
Figure 3 Validation expression value of SEPT3 in clinical specimen. (A) HE staining of TNBC tissue and the adjacent normal tissues. (B) IHC demonstrates immuno-expression of SEPT3 in TNBC tissues.
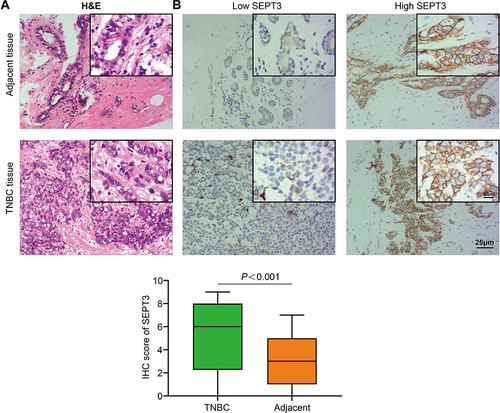
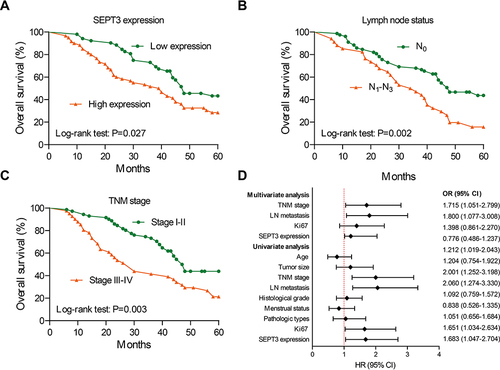
Figure 4 Survival curve of the effect of SEPT3 on the survival time of TNBC patients. (A) Overall survival according to status of SEPT3 expression. (B) Overall survival according to lymph node status. (C) Overall survival according to TNM stage. (D) Univariate and multivariate analysis for overall survival.
Data Sharing Statement
All data can be obtained in TCG, GEO and conclusions of this article will be made available by the corresponding author.