Figures & data
Table 1 Top 5 Authors on Nutrition Combined Exercise Training Research for Sarcopenia in Terms of the Number of Published Articles
Table 2 Basic Characteristics of RCTs on Exercise Combined with Nutrition in Population with Features of Sarcopenia in Recent Years
Figure 1 Flow chart of the retrieval strategy.
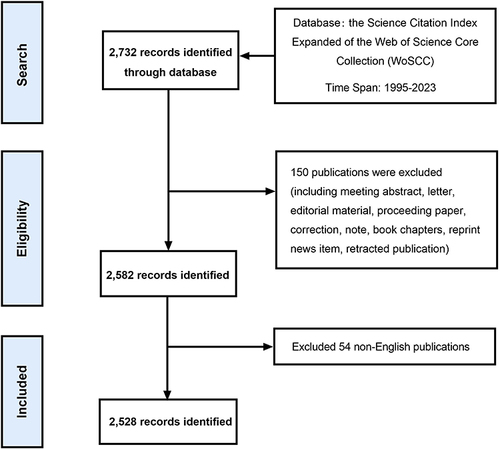
Figure 2 Analysis of contribution and cooperation. (A) Chord diagram of the national publications and cooperation; (B) Cooperation network map between institutions; (C) Cooperation network map between authors.
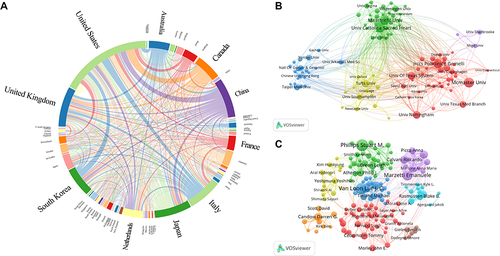
Figure 3 Analysis of keywords on nutrition combined exercise training for sarcopenia. (A) The word cloud of top 50 keyword; (B) Network visualization of keywords and clusters; (C) Timeline visualization of keywords and clusters.
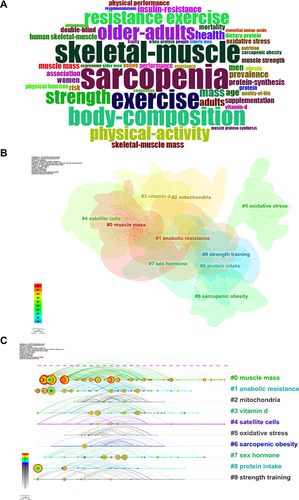
Figure 4 Top 20 keywords with the strongest citation bursts on nutrition combined exercise training research works on sarcopenia.
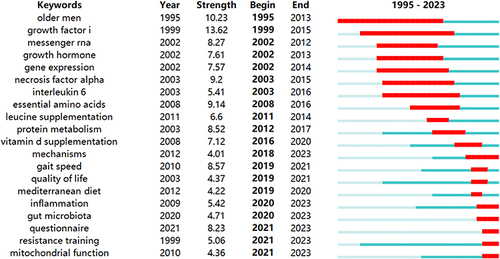
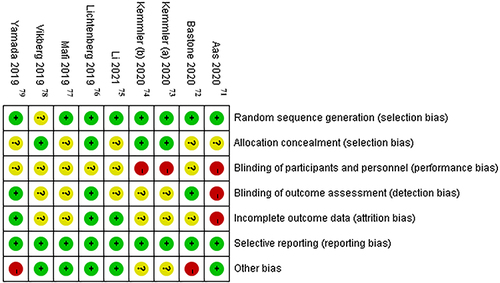
Figure 5 Risk of bias summary displaying the evaluations of each item for 9 RCTs included.