84
Views
0
CrossRef citations to date
0
Altmetric
Hematology

Long-Term Follow-Up of Patients Undergoing Thalidomide Therapy for Transfusion-Dependent β-Thalassaemia: A Single-Center Experience

ORCID Icon, , ORCID Icon, , , , , , & ORCID Icon show all
Pages 1729-1738 | Received 12 Mar 2024, Accepted 24 Apr 2024, Published online: 01 May 2024

Figures & data

Table 1 Baseline Demographic Characteristics of Patients

Figure 1 Treatment, and follow-up. Twenty-nine patients were enrolled in this randomized controlled trial. The placebo-controlled period included data from month 0 (baseline) to 12. Additional 21 patients who meet the inclusion criteria were enrolled in this open-label study. The study population comprised of 50 patients who received at least one dose of thalidomide. (allo-HSCT: allogeneic hematopoietic stem cell transplantation).

Figure 1 Treatment, and follow-up. Twenty-nine patients were enrolled in this randomized controlled trial. The placebo-controlled period included data from month 0 (baseline) to 12. Additional 21 patients who meet the inclusion criteria were enrolled in this open-label study. The study population comprised of 50 patients who received at least one dose of thalidomide. (allo-HSCT: allogeneic hematopoietic stem cell transplantation).

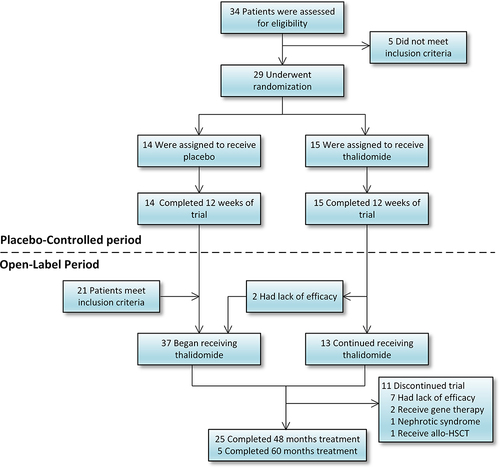
Table 2 Change in Haemoglobin Levels

Figure 2 The mean change in haemoglobin levels from baseline to 24 months after thalidomide treatment. The effective group includes excellent responder, good and minor responders. The level of Hb was expressed as mean ± standard deviation (SD) and P- values were determined by Student’s t-test.

Figure 2 The mean change in haemoglobin levels from baseline to 24 months after thalidomide treatment. The effective group includes excellent responder, good and minor responders. The level of Hb was expressed as mean ± standard deviation (SD) and P- values were determined by Student’s t-test.

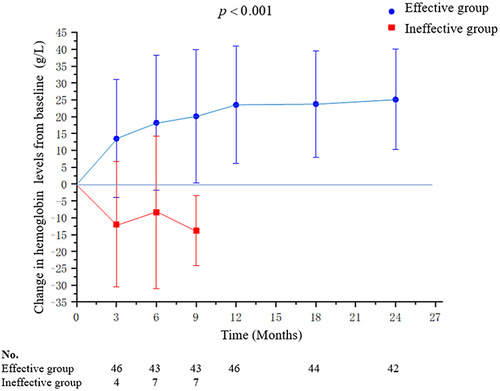
Table 3 Genotype of Patients Who Had an Excellent Response and Thalidomide Maintenance Dose

Figure 3 (A)Changes in liver function from baseline to 48 months. (B) Changes in LDH and CR from baseline to 48 months. (C) Changes in RET and WBC from baseline to 48 months. (D) Changes in PLT from baseline to 48 months.

Figure 3 (A)Changes in liver function from baseline to 48 months. (B) Changes in LDH and CR from baseline to 48 months. (C) Changes in RET and WBC from baseline to 48 months. (D) Changes in PLT from baseline to 48 months.

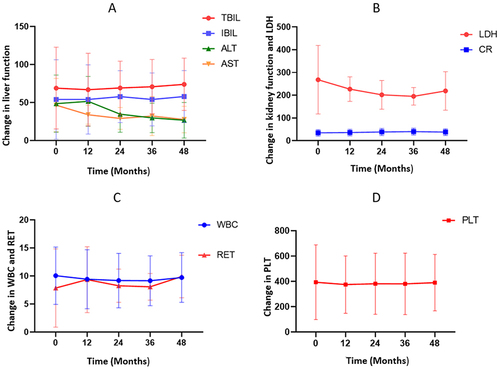
Table 4 Incidence of Adverse Events (AEs)