Figures & data
Table 1 Characteristics of the Subjects
Figure 1 Role of thoracic vertebral bone mineral density (BMD-T8+T9+T10) in identifying osteopenia and osteoporosis based on one American College of Radiology (ACR) criterion. The difference between thoracic vertebral bone mineral density (BMD-T8-T10) and lumbar bone mineral density (LBMD) (A) The kappa test showed moderate agreement in identifying osteoporosis between BMD-T8-T10 and lumbar spine BMD (kappa = 0.51) (B). Compared to those in the gold standard group, the proportions of osteopenia and osteoporosis defined by BMD-T8+T9+T10 groups were significantly different (C) ***, P < 0.001.
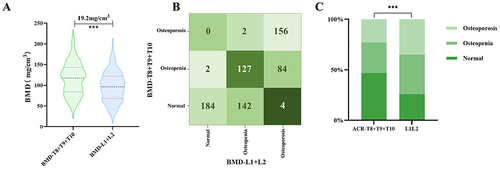
Table 2 Performance of Low Thoracic Vertebral Bone Mineral Density (BMD-T8+T9+T10)
Figure 2 The performance of the thoracic vertebral bone mineral density (BMD-T8+T9+T10) in identifying osteopenia and osteoporosis. Receiver operating characteristic curves (ROC) were generated for the identification of osteopenia (A) and osteoporosis (B). The thresholds were 138 mg/cm3 and 97 mg/cm3. Then, we identified osteopenia and osteoporosis using these two thresholds. The kappa test showed good agreement in identifying osteoporosis between BMD-T8+T9+T10 and lumbar spine BMD (kappa = 0.74) (C). Compared to those of the gold standard group, the proportions of osteopenia and osteoporosis defined by the two thresholds were not significantly different (p > 0.05) (D). NS: not significant.
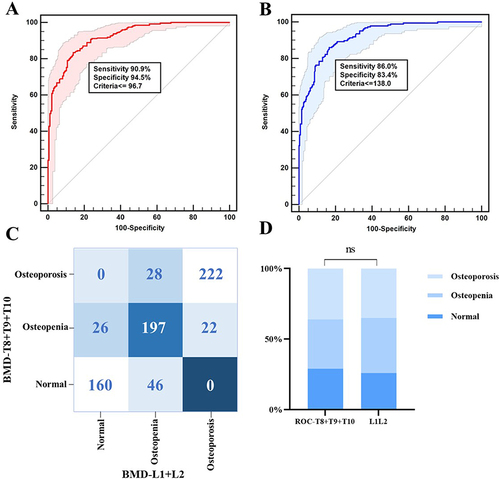
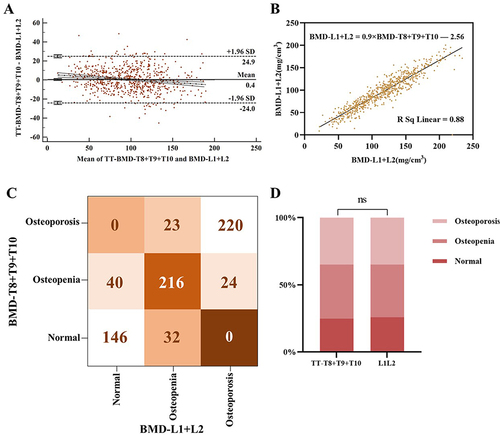
Figure 3 The Bland‒Altman plot also showed good agreement between lumbar bone mineral density (LBMD) and translated thoracic BMD (TTBMD) (A) A formula (LBMD = 0.9 × BMD-T8-T10 – 2.56) was obtained to translate the LBMD based on the thoracic BMD (BMD-T8-T10) (B) and the performance of the translated LBMD in identifying osteopenia and osteoporosis was evaluated. The kappa test showed good agreement in identifying osteoporosis between the TTBMD and LBMD (kappa = 0.74) (C) Compared to those of the gold standard group, the the proportions of osteopenia and osteoporosis defined by TTBMD were not significantly different (p > 0.05) (D) NS: not significant.