
Figures & data
Figure 1 Study flow diagram.
Abbreviations: DVT, deep vein thrombosis; VTE, venous thromboembolism.
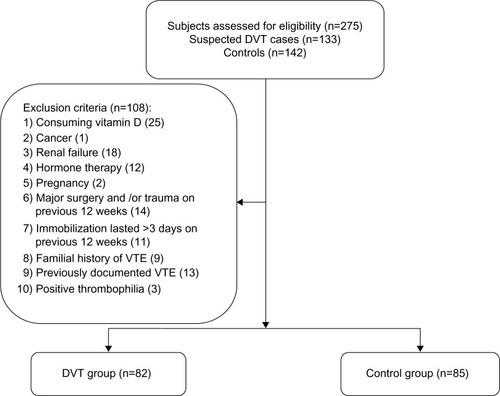
Figure 2 Comparison of 25-hydroxyvitamin D [25(OH)D] levels between the deep vein thrombosis (DVT) and control groups.
![Figure 2 Comparison of 25-hydroxyvitamin D [25(OH)D] levels between the deep vein thrombosis (DVT) and control groups.](/cms/asset/643636df-a0c9-4931-ab55-cc47be827e71/dijg_a_64812_f0002_b.jpg)
Table 1 Characteristics and vitamin D status of participants with idiopathic DVT compared to healthy controls
Figure 3 Comparison of 25-hydroxyvitamin D [25(OH)D] levels between the subgroups by characteristics among deep vein thrombosis (DVT) participants.
Abbreviations: DM, diabetes mellitus; HTN, hypertension; DLP, dyslipidemia.
![Figure 3 Comparison of 25-hydroxyvitamin D [25(OH)D] levels between the subgroups by characteristics among deep vein thrombosis (DVT) participants.](/cms/asset/6169492d-578e-408d-a3d2-9a1b9c6c656e/dijg_a_64812_f0003_b.jpg)
Table 2 Characteristics and vitamin D status of participants in the DVT subgroups based on 25(OH)D status
Table 3 Logistic regression analysis for detecting the independent predictors of DVT