Figures & data
Table 1 Demographic features of the Russian efficacy/safety populations in the OSVaLD study
Figure 1 Changes from baseline in components of the DHI and in total DHI score in the Russian efficacy population of the OSVaLD study. Negative change values signify a reduced level of disability. P<0.0001 for all intradomain comparisons.
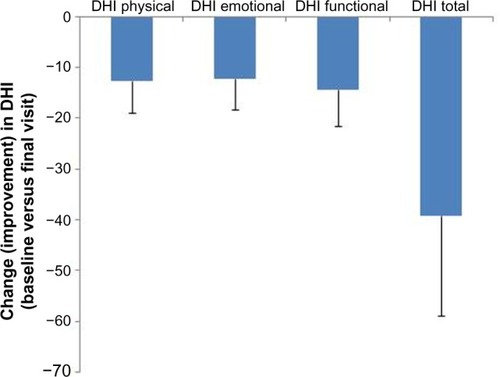
Figure 2 Changes from baseline in the domains of the SF-36v2 instrument in the Russian efficacy population of the OSVaLD study. Data shown are mean ± SD. Higher numbers signify a better level of functioning. P<0.0001 for all intradomain comparisons.
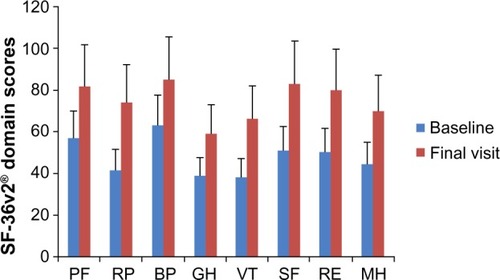
Table 2 On-study trends in the PCS and MCS subscales of the SF-36v2® in the Russian efficacy population of the OSVaLD study
Table 3 Trends in HADS-A and HADS-D scores and distributions in the Russian efficacy population of the OSVaLD study (n=204)
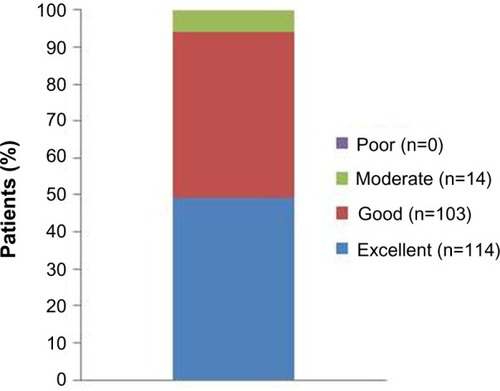
Figure 3 Patients’ impression of betahistine therapy in the Russian efficacy population of OSVaLD.