
Figures & data
Table 1 Seroprevalence of measles virus infection in children in relation to hospital location
Figure 1 Seroprevalence of measles virus infection in children in relation to their age category (χ2=97.195, df=1, odds ratio 23.118, P=0.00).
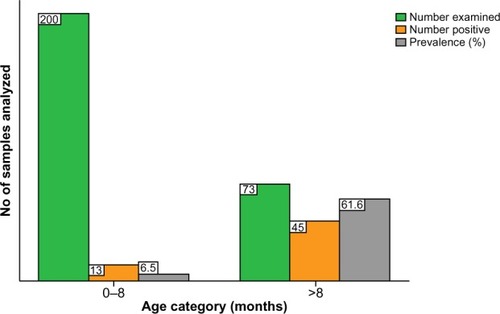
Figure 2 Seroprevalence of measles virus infection in children in relation to their sex (χ2=5.006, df=1, odds ratio 1.942, P=0.025).
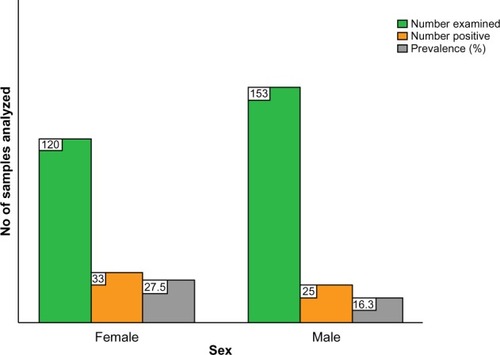
Table 2 Seroprevalence of measles virus infection in children in relation to parental sociodemographic data
Table 3 Seroprevalence of measles virus infection in children in relation to their vaccination and nutritional status
Table 4 Seroprevalence of measles virus infection in children in relation to family type and possible risk factors
Table 5 Seroprevalence of measles virus infection in children in relation to maternal measles history and vaccination status
Table 6 Seroprevalence of measles virus infection in children in relation to disease symptoms
Table 7 Seroprevalence of measles virus infection in children in relation to common childhood diseases with measles-like symptoms