
Figures & data
Table 1 Daily air temperature before the start of the race, maximum temperature during the day, and temperature at the finish of each stage
Figure 1 Changes in split and overall race times across the 10 days.
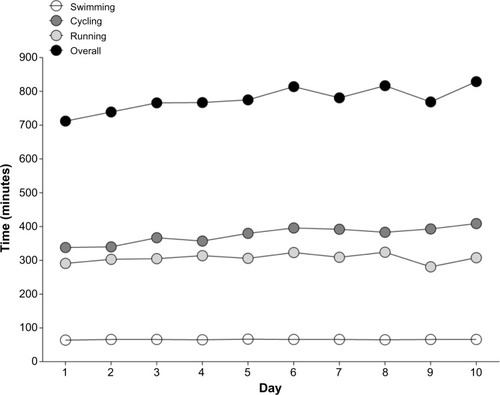
Figure 2 Association between fluid intake and change in foot volume during the stages (A) and associations between volume of the foot at the end of the stages with total body water (B), creatinine (C), and urea (D) at the end of the stages.
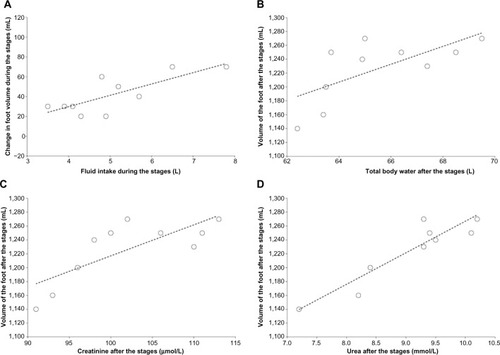
Table 2 Changes in anthropometric characteristics in the morning before the stages, in the evening after the stages, and the difference between the values
Table 3 Changes in energy and fluid turnover during the ten stages
Table 4 Changes in urine and blood parameters in the morning before the stages, in the evening after the stages, and the difference between the values