Figures & data
Figure 1 CONSORT diagram of the study selection process.
Abbreviations: RCT, randomized control trial; CONSORT, Consolidated Standards of Reporting Trials.
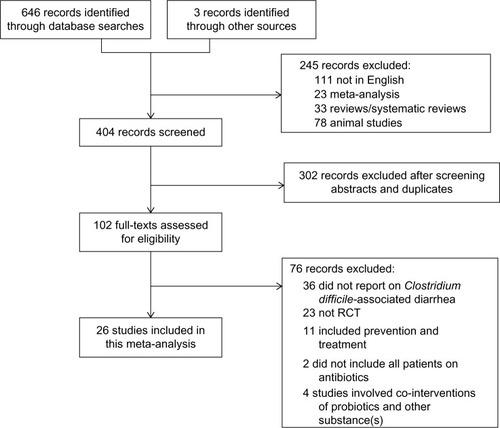
Table 1 Characteristics of all published randomized control trials evaluating the use of probiotics for the prevention of CDAD (1966–2015)
Figure 2 Forest plot evaluating the RR of CDAD associated with probiotic use.
Abbreviations: RR, relative risk; CI, confidence interval; CDAD, Clostridium difficile-associated diarrhea.
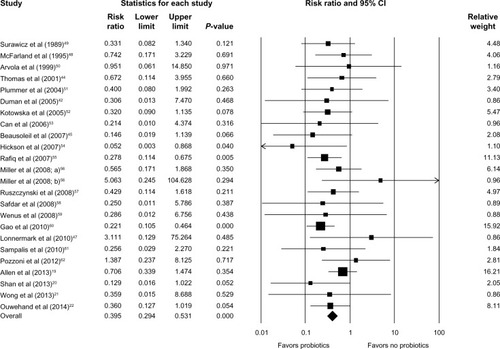
Figure 3 Forest plot evaluating the RR of CDAD associated with various species of probiotic use.
Abbreviations: RR, relative risk; CI, confidence interval; CDAD, Clostridium difficile-associated diarrhea.
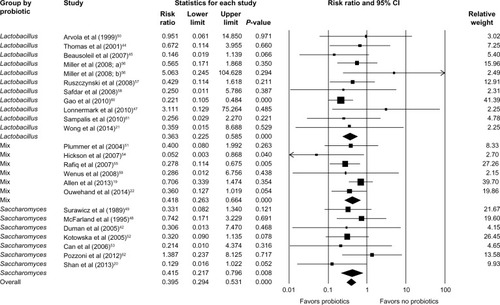
Figure 4 Forest plot evaluating the RR of CDAD associated with probiotic use in adult and pediatric populations.
Abbreviations: RR, relative risk; CI, confidence interval; CDAD, Clostridium difficile-associated diarrhea.
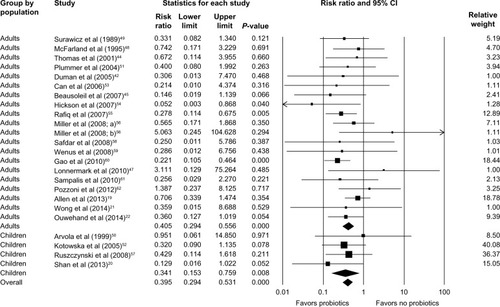
Figure 5 Forest plot evaluating the RR of CDAD associated with probiotic use in both inpatient and outpatient populations.
Abbreviations: RR, relative risk; CI, confidence interval; CDAD, Clostridium difficile-associated diarrhea.
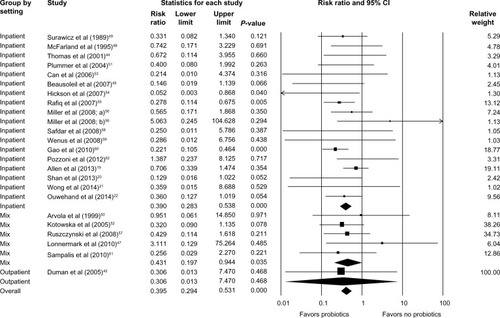
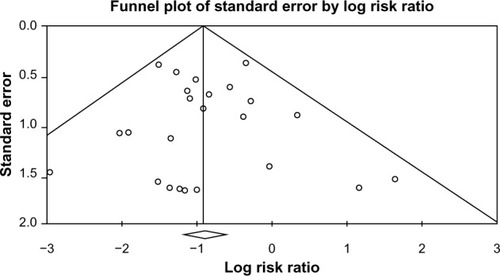
Figure 6 Funnel plot assessing publication bias (analyzing the effect of probiotic supplementation on the incidence of CDAD).
Abbreviation: CDAD, Clostridium difficile-associated diarrhea.