Figures & data
Figure 1 A model for drug discovery using patient-derived hiPSCs.
Notes: The process begins with the derivation of hiPSCs from a patient harboring a specific disease phenotype. These hiPSCs can then be directed to differentiate to a cell type of interest to model the development and progression of the disease. High-throughput drug screens can identify potential drugs to alleviate/cure the disease.
Abbreviation: hiPSCs, human-induced pluripotent stem cells.
Abbreviation: hiPSCs, human-induced pluripotent stem cells.
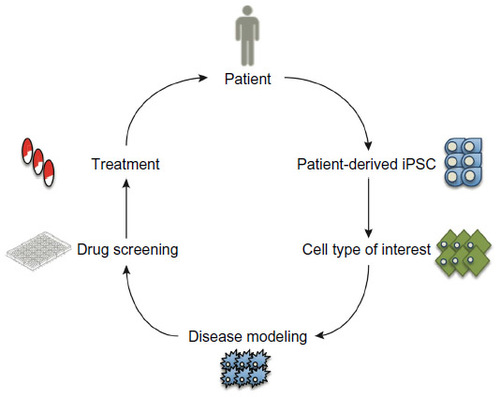
Figure 2 hPSCs can differentiate to derivatives of all three embryonic germ layers (ectoderm, mesoderm, endoderm).
Notes: Drug discovery requires directed differentiation of hPSCs to pharmaceutically relevant cell types. The initial directions are mesendoderm and ectoderm through the combined activation or inhibition of TGFβ/Activin A/Nodal and BMP pathways, respectively. Further differentiated cell types can then be derived, again through the activation or inhibition of signaling pathways. These methods employ the use of both recombinant proteins and chemical inhibitors.
Abbreviations: hPSCs, human pluripotent stem cells; TGFβ, transforming growth factor beta; BMP, bone morphogenetic protein; FGF, fibroblast growth factor; Shh, sonic hedgehog; VEGF, vascular endothelial growth factor; DKK1, Dickkopf-related protein 1; EGF, epidermal growth factor; RA, retinoic acid.
Abbreviations: hPSCs, human pluripotent stem cells; TGFβ, transforming growth factor beta; BMP, bone morphogenetic protein; FGF, fibroblast growth factor; Shh, sonic hedgehog; VEGF, vascular endothelial growth factor; DKK1, Dickkopf-related protein 1; EGF, epidermal growth factor; RA, retinoic acid.
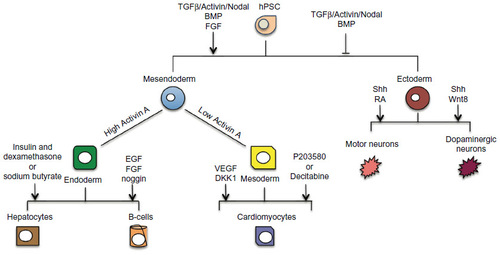
Figure 3 High-content imaging of hPSCs allows detection of cell phenotypes based on cell numbers, morphology, and marker staining.
Notes: (A) A workflow of a high-content primary screen on hPSCs. (B) Human ESC colonies grown on Matrigel in mTESR, stained for markers of undifferentiated state OCT4 (POU5F1, green) and SSEA3 (red). Nuclei are counterstained with Hoechst 33342. The absence of OCT4 and SSEA3 staining in some cells is indicative of spontaneous differentiation. Images were obtained with the InCell Analyzer 2000 (GE Healthcare) high-content imaging platform. Scale bar, 200 μm.
Abbreviations: hPSCs, human pluripotent stem cells; ESC, embryonic stem cell; OCT4, octamer-binding transcription factor 4; SSEA3, stage-specific embryonic antigen 3.
Abbreviations: hPSCs, human pluripotent stem cells; ESC, embryonic stem cell; OCT4, octamer-binding transcription factor 4; SSEA3, stage-specific embryonic antigen 3.
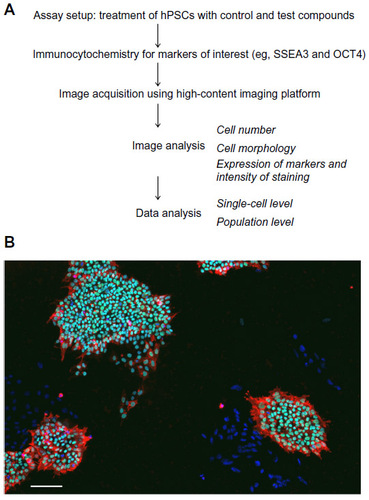
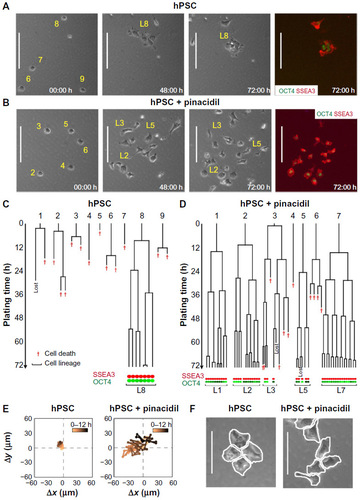
Figure 4 Time-lapse imaging allows detailed analysis of hPSC survival, proliferation, motility, morphology, and spatial distribution of cells in colonies.
Notes: (A) Frozen frames from a time-lapse experiment of hPSCs monitored over 72 hours from the time of plating. Scale bar, 50 μm. Labels 1–9 indicate initial plated cells, and L8 denotes the lineage corresponding to cell 8 (also shown in (C)). After 72 hours, cells were fixed, and stained with OCT4 (green) and SSEA3 (red). (B) Time-lapse imaging of hPSCs treated with a pro-survival compound, pinacidil,Citation129 over 72 hours post-plating. Scale bar, 50 μm. Labels 1–7 indicate initial plated cells, and L1–L7 denote corresponding cell lineages (also shown in (D)). After 72 hours, emerging colonies were fixed and stained with OCT4 (green) and SSEA3 (red). (C) Lineage trees produced by tracking single cells from movies depicted in (A). Only rare hPSCs were able to proliferate and form colonies that express markers of undifferentiated state. (D) Lineage trees produced by tracking single cells from movies depicted in (B), showing improved survival post-plating, reentry into the cell cycle, and survival post-division of pinacidil-treated hPSCs. (E) Representative examples of single-cell trajectories show increased motility of hPSCs upon treatment with pinacidil. (F) Single-cell detection of cells in colonies reveals detailed information of morphology and cell–cell contact. Most of the pinacidil-treated colonies are loosely packed, and single cells exhibit morphology differences compared to cells in untreated cultures. Scale bar, 25 μm.
Abbreviations: hPSC, human pluripotent stem cell; OCT4, octamer-binding transcription factor 4; SSEA3, stage-specific embryonic antigen 3; h, hours.
Abbreviations: hPSC, human pluripotent stem cell; OCT4, octamer-binding transcription factor 4; SSEA3, stage-specific embryonic antigen 3; h, hours.