Figures & data
Figure 1 Prussian Blue stain for mesenchymal stem cells labeled with Resovist®.
Notes: Incubation at 0.2 mM Fe with protamine sulfate (A). Incubation of Resovist® at 2 mM Fe without protamine sulfate (B) resulted in higher NP uptake compared to (A). High amounts of extracellular iron are visible after both treatments (A and B). Extracellular matrix disruption and passage removed extracellular nanoparticles, allowing identification of true NP uptake (C and D). Insets a–d show corresponding images with higher magnification (40×). All scale bars correspond to 500 µm. Quantification of average Fe per cell (pg) revealed similar results for MSC labeled with MCP and VSOP (E).
Abbreviations: ECM, extracellular matrix; MCP, multicore carboxy-methyl-dextran-coated iron oxide nanoparticle; NP, nanoparticle; VSOP, very small iron oxide nanoparticle.
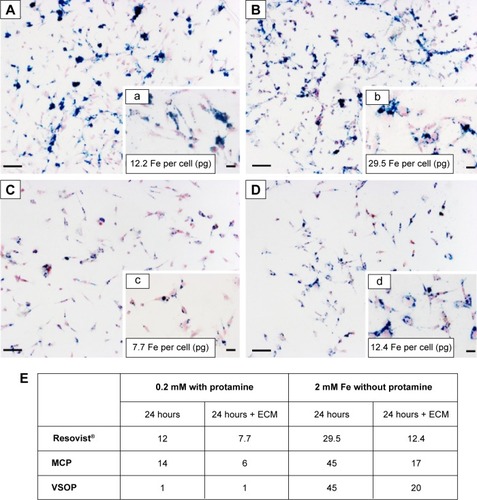
Figure 2 Increasing the NP labeling concentrations was sufficient to increase cellular NP uptake, allowing us to avoid use of protamine sulfate.
Notes: Cells were loaded at 0.2 mM with Resovist® or MCP in combination with 12 µg/mL PS or VSOP alone (open symbols) and cells loaded at 2 mM without PS for all three NPs (filled symbols). Iron quantification after 24-hour incubation and ECM disruption indicates that Resovist®-PS complexes have better uptake by MSC than MCP-PS. VSOP show poor uptake at low (0.2 mM) loading concentration. However, 10× higher loading concentration (2 mM) in absence of PS was sufficient to significantly increase cellular uptake of all NPs. (mean; error bars, ± SD).
Abbreviations: ECM, extracellular matrix; MCP, multicore carboxy-methyl-dextran- coated iron oxide nanoparticle; NP, nanoparticle; PS, protamine sulfate; VSOP, very small iron oxide nanoparticle.
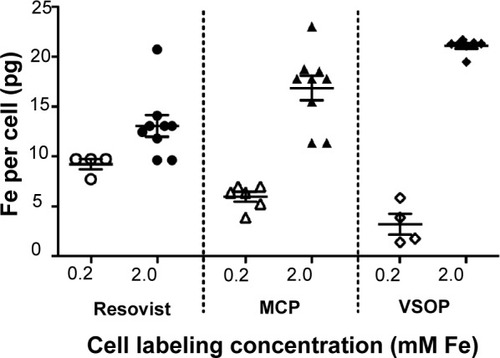
Figure 3 In vitro assays for nanoparticle cell biocompatibility.
Notes: Cells labeled with Resovist®, MCP, or VSOP show similar population doubling time as unlabeled cells (empty) over 10 days (Days 2, 4, 6, and 10 are shown) (mean; bars, ± SD; n=3) (A). Cells maintained both their mesenchymal stem cell (MSC) character and their self-renewal capacity, showing similar number of colony-forming units (CFU) for labeled and unlabeled cells (B). Multipotent differentiation potential (adipogenesis, chondrogenesis, and osteogenesis) of labeled MSC was similar to unlabeled cells as shown by Oil Red, Alcian Blue, and von Kossa stains (C). All scale bars represent 100 µm.
Abbreviations: MCP, multicore carboxy-methyl-dextran-coated iron oxide nanoparticle; VSOP, very small iron oxide nanoparticle.
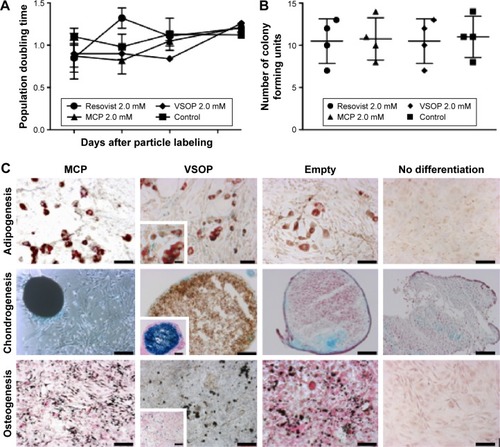
Figure 4 Calculation of cell detection ratio by counting magnetic field microdistortions caused by nanoparticle-labeled mesenchymal stem cells embedded in agarose.
Notes: Postprocessed phase images of T2*-weighted MR images were mainly used to detect cells labeled with Resovist® (A), MCP (B), and VSOP (C), and empty cells (D) at 1,000 cells/mL (A1, B1, and C1) or at 2,000 cells/mL (A2, B2, C2, and D). The upper row shows the MRI magnitude images and the lower row the corresponding postprocessed phase images, which allow better discrimination and counting of the single cells. These phase images show the characteristic dipole figures of the cells, which correspond to positive phase shifts at the poles and negative phase shifts at the equator (E).
Abbreviations: MCP, multicore carboxy-methyl-dextran-coated iron oxide nanoparticle; MRI, magnetic resonance imaging; VSOP, very small iron oxide nanoparticle.
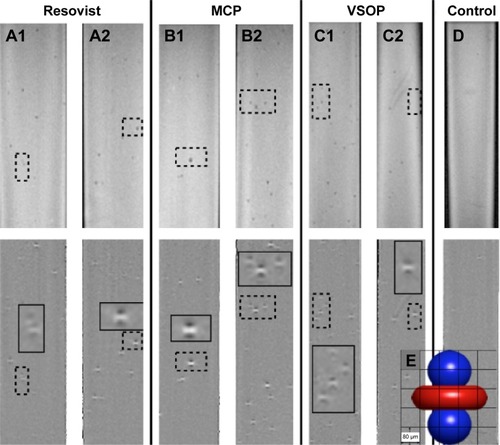
Figure 5 MRI quantification of single cells in agarose phantoms and correlation with intracellular iron content for cells labeled with Resovist®, MCP, and VSOP.
Notes: Increasing iron uptake correlates with increasing MRI detection (mean; bars, ± SD; n=4) for single cells. VSOP-MSC average detection increased from 14% (4 pg Fe per cell) to 43% (21 pg Fe per cell). Resovist®-MSC average detection increased from 28% (9.2 pg Fe per cell) to 44% (13 pg Fe per cell) and MCP-MSC detection from 28% (6 pg Fe per cell) to 45% (17 pg Fe per cell).
Abbreviations: MCP, multicore carboxy-methyl-dextran-coated iron oxide nanoparticle; MRI, magnetic resonance imaging, MSC, mesenchymal stem cells; VSOP, very small iron oxide nanoparticle.
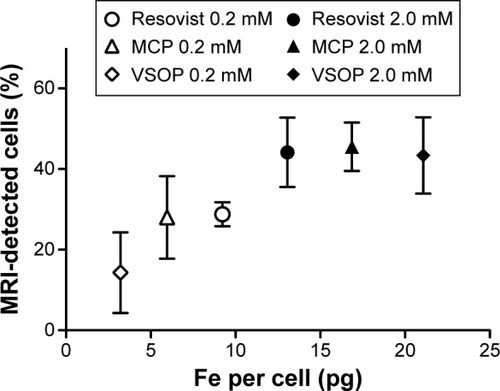
Figure 6 MRI detection at 7 T of mesenchymal stem cells in mouse brain after carotid injection of 2,000 NP-labeled cells.
Notes: Improved visualization of magnetic field microdistortions in phase images (lower row) vs magnitude images (upper row) is observed for all NP-labeled MSC. Single microdistortions correspond to MSC labeled with Resovist® (A), MCP (B), and VSOP (C). Cells are visualized in the left hemisphere (supine position), while the right side is mostly free of cells and served as background control. Superparamagnetic iron quantification by MPS (D) confirmed that MRI signal was specific to NPs in the left hemisphere of mice injected with Resovist®-labeled (6.5 ng) and MCP-labeled MSC (13.1 ng), while corresponding right hemispheres had no signal for NPs, and total NP amount in brain (C) was too small to be detected (out of range).
Abbreviations: MCP, multicore carboxy-methyl-dextran-coated iron oxide nanoparticle; MPS, magnetic particle spectroscopy; OR, out of range; NP, nanoparticle; VSOP, very small iron oxide nanoparticle.
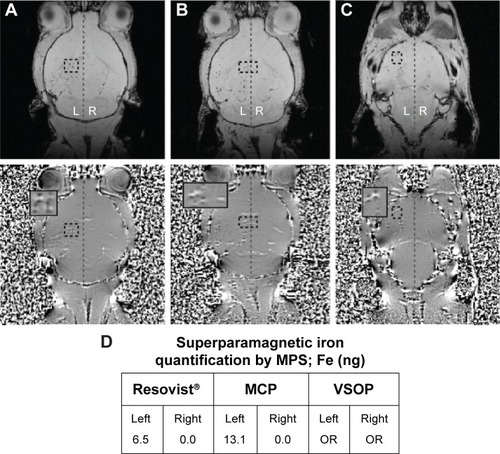
Table 1 Analytical properties of the nanoparticles used in our experiments
Figure S1 Mesenchymal stem cell surface marker expression.
Notes: MSC surface marker expression for cells without nanoparticles (empty cells: dotted gray line histograms) is similar to that of VSOP-labeled cells (continuous black line). In addition, histograms for VSOP-labeled cells without staining for MSC surface markers (broken gray line) show low fluorescent background.
Abbreviations: MSC, mesenchymal stem cells; VSOP, very small iron oxide nanoparticle; APC, Allophycocyanin; FITC, Fluorescein Isothiocyanate; PE, Phycoerythrin.
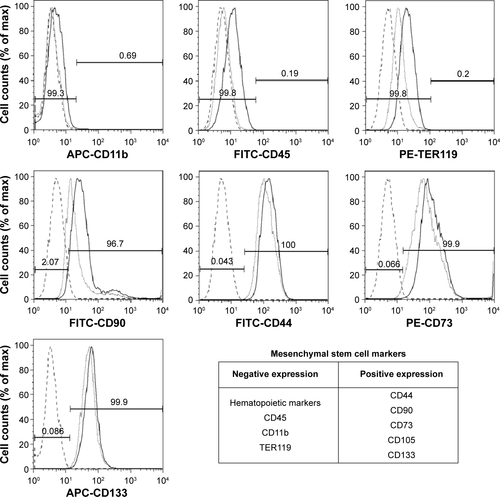
Figure S2 Agarose phantom of labeled MSC imaged on 7 T Biospec vs 7 T Pharmascan MRI (Bruker).
Notes: MRI of agarose phantoms using a Bruker BioSpec MRI scanner with CryoProbe (A1–D1) has higher resolution and improves the signal-to-noise ratio (SNR: 86) in comparison to 7 T Pharmascan MRI (SNR: 60) (A2–D2). Hence, the detection of magnetic field microdistortions caused by NP-labeled MSC in postprocessed phase images was improved, and the percentage of quantified single cells was two- to three-fold higher for the 7 T BioSpec. The Biospec MRI scanner has recently become available to us, and these results promise improvements for MRI with single-cell sensitivity in future in vivo experiments.
Abbreviations: 7 T, 7 Testla; MCP, multicore carboxy-methyl-dextran-coated iron oxide nanoparticle; MRI, magnetic resonance imaging; MSC, mesenchymal stem cell; NP, nanoparticle; VSOP, very small iron oxide nanoparticle.
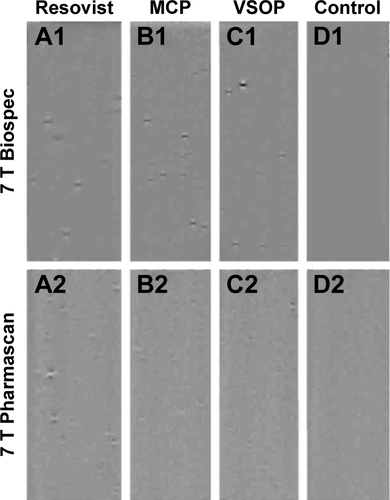
Figure S3 MRI detection at 7 T of MSC in mouse brain after carotid injection of MCP-labeled cells.
Notes: Magnitude (A1–C1) and phase images (A2–C2) of mouse brain before injection (A), after injection of nonlabeled cells (B), and after injection of 1,000 MCP-labeled MSC (C). MSC trapped in blood vessels of the left hemisphere are visible as signal reductions in the magnitude image (C) and as dipole figures in the phase image (MFMD) (C2). (FLASH gradient-echo sequence, 80 µm in-plane resolution, slice thickness 300 µm, TE 5.4 milliseconds, TR 400 milliseconds).
Abbreviations: MRI, magnetic resonance imaging; MCP, multicore superparamagnetic nanoparticles; MSC, mesenchymal stem cells; MFMD, magnetic field microdistortion; TE, echo time; TR, repetition time.
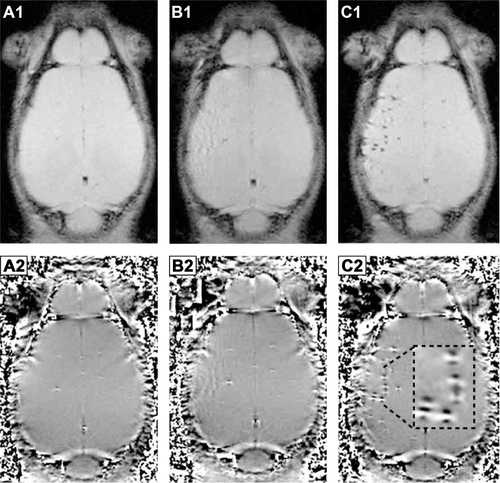
Figure S4 Effect of cell density, nanoparticle concentration, and ratio of NP to protamine sulfate on NP uptake by MSC.
Notes: MSC at variable cell densities were labeled with MCP in combination with protamine sulfate (PS) at different ratios and stained for iron using the Prussian Blue stain protocol. Cell incubation with increasing NP concentration with and without PS (25:0) increased cellular NP uptake for MSC at 15,000 cells/cm2. Increasing cell density caused high extracellular matrix and high NP aggregation when incubated with MCP-PS complexes as observed for 40,000 cells/cm2 with MCP-PS at ratios of 10:12 and 25:30. However, cell recovery was decreased after MSC incubation with high PS concentration (25:30). Overall, more efficient cellular recovery and cellular NP uptake were achieved when MSC were cultured at 15,000 cells/cm2 and incubated with MCP-PS complexes at 10:12 ratio or with high NP concentration but without PS (25:0).
Abbreviations: MSC, mesenchymal stem cells; MCP, multicore superparamagnetic nanoparticles; PS, protamine sulfate; NP, nanoparticle.
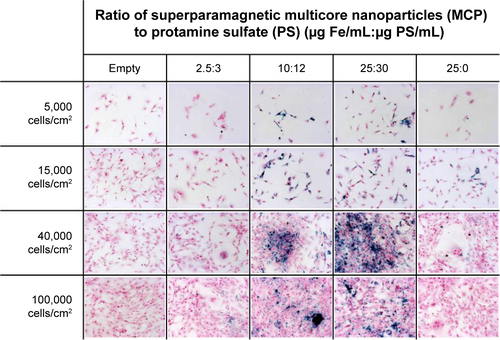
Figure S5 Example to illustrate the intracellular uptake of VSOP and MCP by MSC by TEM.
Notes: MSC were incubated with nanoparticles (2 mM) for 24 hours, followed by washing steps and extracellular matrix removal (24 hours + ECM) as described in “Methods” section. NP clustering engulfed by phagolysosomes proves intracellular uptake for VSOP and MCP. All scale bars correspond to 100 nm.
Abbreviations: ECM, extracellular matrix; MCP, multicore superparamagnetic nanoparticles; MSC, mesenchymal stem cells; NP, nanoparticle; TEM, transmission electron microscopy; VSOP, very small iron oxide nanoparticles.
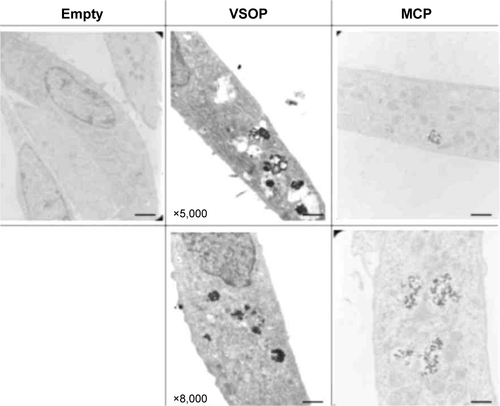
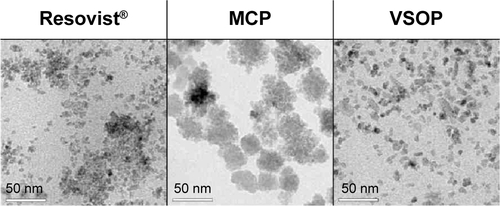
Figure S6 Nanoparticle TEM study.
Notes: Nanoparticle size and morphology were analyzed by HRTEM using a TECNAI G2 20 S-Twin (FEI-Company, Hillsboro, OR, USA). TEM samples were prepared by coating copper grids with diluted nanoparticle solutions.
Abbreviations: TEM, transmission electron microscopy; HRTEM, high-resolution transmission electron microscopy.