Figures & data
Table 1 The three Ti–Sr–O coating groups used throughout this study
Figure 1 Micro-computed tomography images.
Notes: (A) Tibia control and (B) tibia from ovariectomized rat (OVX) 14 weeks after bilateral OVX. The tibia from the OVX rat shows ~50% less bone volume compared to control; measurements were taken 2 mm away from the epiphyseal plate (indicated by red arrows and dotted lines). Scale bars are 1,000 μm.
Abbreviation: OVX, ovariectomy.
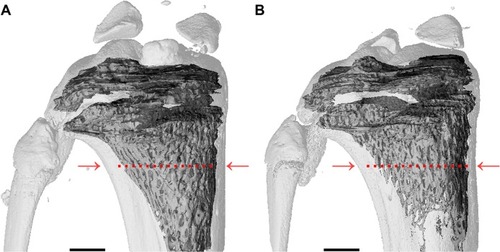
Figure 2 Surgical procedure shown in four steps.
Notes: (A) Exposed knee cap after incision; (B) drill between the medial collateral ligament and patella tendon; (C) inserted implant (marked with yellow arrow); and (D) skin suture.
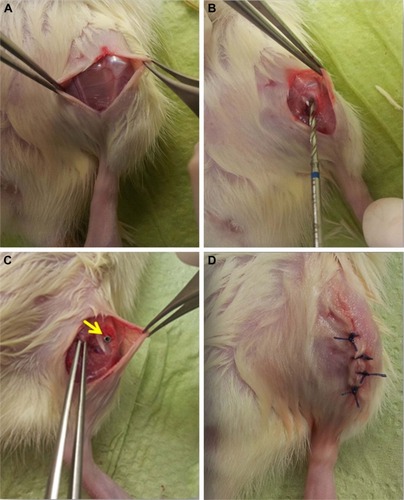
Figure 3 Histological samples, stained with toluidine blue, including reference boxes and magnified images.
Notes: Reference box was 250×3,000 mm2 and marks the standard area used to evaluate new bone formation: (A) 6 weeks, grade 4 Ti reference; (B) 6 weeks, unmodified 2,000 nm Ti–Sr–O coating; (C) 12 weeks, grade 4 Ti reference; and (D) 12 weeks, unmodified 2,000 nm Ti–Sr–O coating. The area of new bone formation inside the reference box was measured for all samples and used to calculate the percentage of de novo bone synthesis (marked with yellow arrows) with respect to the total reference area. In all cases, the edge of the reference area was at least 2 mm away from the growth plate. The side of the reference box facing the implant surface was also used to evaluate the percentage of direct BIC with respect to the total length of the reference. Scale bars are 1,000 μm.
Abbreviation: BIC, bone-to-implant contact.
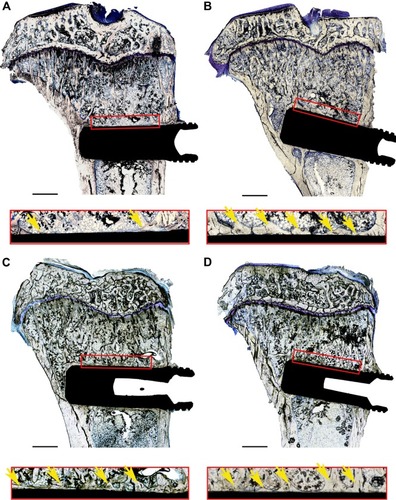
Table 2 Elemental composition of the surfaces of the tested coatings expressed as at%
Figure 4 SEM images of the two basis coatings deposited onto Si wafer substrates.
Notes: The intermediate Ti binding layer and Ti–Sr–O layer are indicated by the dotted lines: (A) 1,500 nm Ti–Sr–O coating. (B) 2,000 nm Ti–Sr–O coating. The morphology of the two coatings appears highly similar, having a column-like structure. Moreover, the structure appears granular and porous, and this has been found to be a key feature in relation to obtaining the desired Sr release characteristics.
Abbreviation: SEM, scanning electron microscopy.
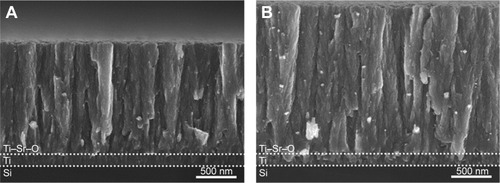
Figure 5 Accumulated Sr release from the three Ti–Sr–O groups as determined by ICP-AES.
Notes: (A) The accumulated amount of Sr released over a period of 14 days. It is evident that the 2,000 nm (no wash) coating presents the highest release value, while the release of the 2,000 nm (industrial wash) and the 1,500 nm (22 minutes) is significantly lower. By presenting the accumulated release, the amount released within the first day greatly influences the graphical representation. (B) The accumulated amount of Sr release in the period between days 1 and 14. Here, the data from the initial 24 hours are omitted as indicated by the dashed line. Standard deviations for the measured values are included. However, for the majority of the measurements, these are smaller than the utilized markers. The legend applies to both graphs.
Abbreviation: ICP-AES, inductively coupled plasma atomic emission spectroscopy.
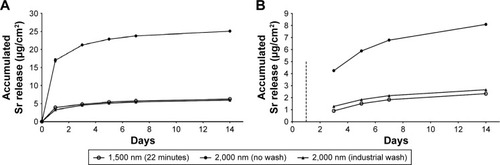
Figure 6 Ra measured on the surface of the four different implant groups.
Note: No statistical significant differences between the groups were found.
Abbreviation: Ra, surface roughness.
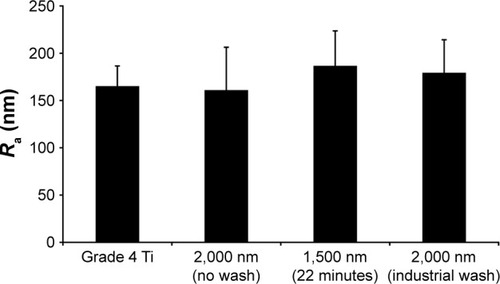
Figure 7 In vivo data 6 weeks after implantation.
Notes: (A) Percentage of new bone formation (BA%). (B) Percentage of direct bone-to-implant contact (BIC%). Significant differences with respect to the grade 4 Ti reference are marked with **P<0.01 and ***P<0.001. Significant differences with respect to 2,000 nm with no wash are marked with †P<0.05.
Abbreviations: BA%, bone area percentage; BIC%, bone-to-implant contact percentage.
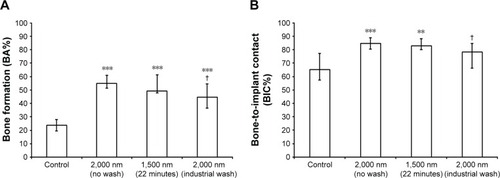
Figure 8 In vivo data 12 weeks after implantation.
Notes: (A) Percentage of new bone formation (BA%). (B) Percentage of direct BIC. Significant differences with respect to grade 4 Ti reference are marked with *P<0.05, **P<0.01, and ***P<0.001.
Abbreviations: BA%, bone area percentage; BIC%, bone-to-implant contact percentage.
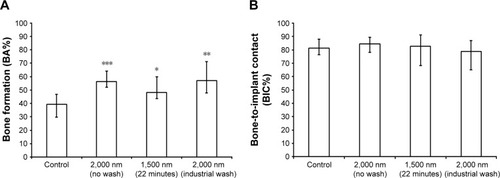
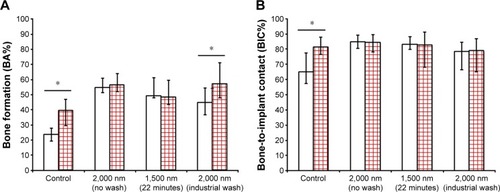
Figure 9 Comparison of (A) BA% and (B) BIC% after 6 weeks (white column) and 12 weeks (red squared column) postimplantation.
Note: Significant differences between the two time intervals are marked with *P<0.05.
Abbreviations: BA%, bone area percentage; BIC%, bone-to-implant contact percentage.