Figures & data
Figure 1 Transmission electron micrographs of A) uncoated liposomes and B) CH-coated liposomes. Bar is 100 nm.
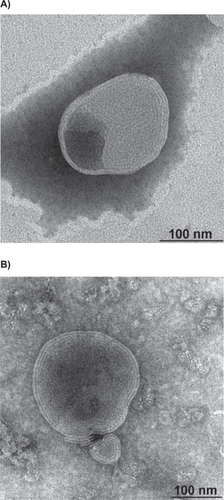
Figure 2 The influence of CH concentration on the size of CH-coated liposomes (n = 3).
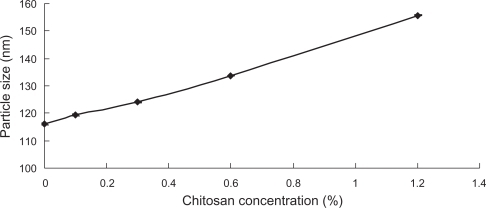
Figure 3 The influence of CH concentration on the zeta potential of CH-coated liposomes (n = 3).
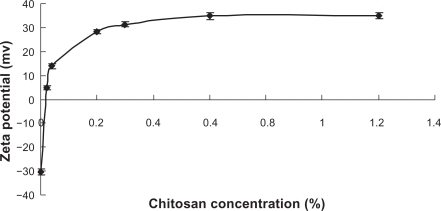
Figure 4 The effect of CH concentration on the entrapment efficiency of MTO (n = 3).
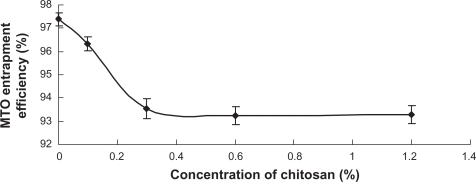
Figure 5 The desorption of CH from the coated liposomes (♦) using CH solution as control (▪) (n = 3).
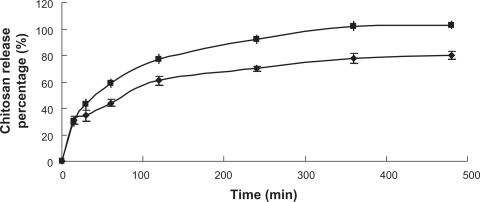
Figure 6 Relative particle size of liposomes coated with CH after FD-RH compared to that before FD-RH.
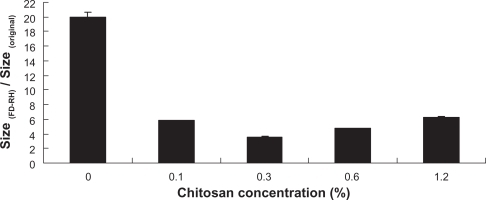
Figure 7 In vitro release of MTO from uncoated liposomes (♦), CH-coated liposomes (0.6%) (▪), and CH-coated liposomes (0.3%) (▴) in serum using MTO aqueous solution as control (–) (n = 3).
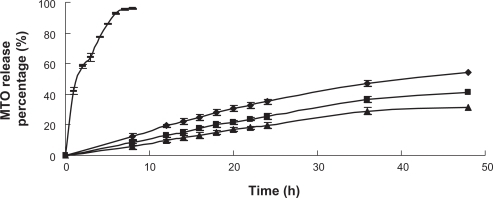
Figure 8 Semi-log plasma concentration-time profiles in rats after intravenous administration of MTO solution (▪), uncoated liposomes (♦), CH-coated liposomes (0.6%) (▴), and CH-coated liposomes (0.3%) (•) (n = 6).
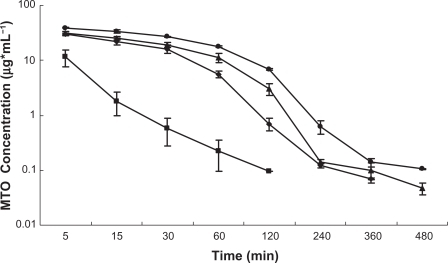
Table 1 Mean pharmacokinetic parameters of MTO after intravenous administration of MTO solution, uncoated liposomes, CH (0.3%) and CH (0.6%)-coated liposomes