Figures & data
Figure 1 The characterization of SiNPs.
Notes: TEM image shows SiNPs have a near-spherical shape and good monodispersity, with an average diameter of 57.66 nm.
Abbreviations: SiNPs, silica nanoparticles; TEM, transmission electron microscopy.
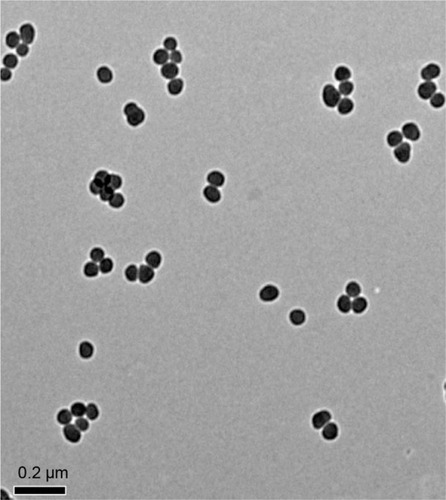
Figure 2 The effects of SiNPs on the structure of testicular tissue in mice.
Notes: (A and D) The shape of seminiferous tubles and the cell arrangement were regular in the control group on the 45th day after the first dose. (B and E) The shape of seminiferous tubles and the cell arrangement were regular in the saline control group on the 45th day after the first dose. (C and F) The shape of seminiferous tubles and the cell arrangement were irregular after exposure to SiNPs for 45 days. SiNPs led to vacuolization and exfoliated cells in some seminiferous tubles. (G and J) The shape of seminiferous tubles and the cell arrangement were regular in the control group on the 75th day after the first dose. (H and K) The shape of seminiferous tubles and the cell arrangement were regular in the saline control group on the 75th day after the first dose. (I and L) The shape of seminiferous tubles and the cell arrangement were regular in the SiNPs group on the 75th day after the first dose, and the vacuolization and exfoliated cells in some seminiferous tubles induced by SiNPs weren’t observed. The figure shows optical microscope images of testis. The thin black arrow represents the vacuolization, and the wide black arrow represents the exfoliated cells. The data indicated that SiNPs could damage the seminiferous epithelium in testis of mice.
Abbreviation: SiNPs, silica nanoparticles.
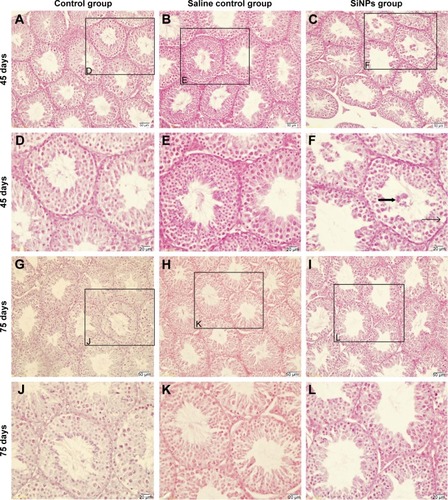
Figure 3 The effects of SiNPs on the ultrastructure of testicular tissue in mice.
Notes: (A–D) The ultrastructure of testes in the control group on the 45th day after the first dose. (E–H) The ultrastructure of testes in the saline control group on the 45th day after the first dose. (I and J) SiNPs were observed in the SiNPs group on the 45th day after the first dose. (K and L) SiNPs led to swollen mitochondria and changed the shape of the cross-sections of the sperm tail in the SiNPs group on the 45th day after the first dose. (M–P) The ultrastructure of testes in the control group on the 75th day after the first dose. (Q–T) The ultrastructure of testes in the saline control group on the 75th day after the first dose. (U–X) The ultrastructure of testes in the SiNPs group on the 75th day after the first dose. The swollen mitochondria weren’t observed, and the shape of the cross-sections of the sperm tail were similar to that in the saline control group. The figure shows TEM images of testis. The thin black arrow represents the mitochondria, thin white arrow represents the cell membrane or nuclear membrane, wide white arrow represents the cross sections of the sperms, and wide black arrow represents the SiNPs. The data indicated that SiNPs could accumulate in the testis and damage the mitochondria and sperms.
Abbreviations: SiNPs, silica nanoparticles; TEM, transmission electron microscopy.
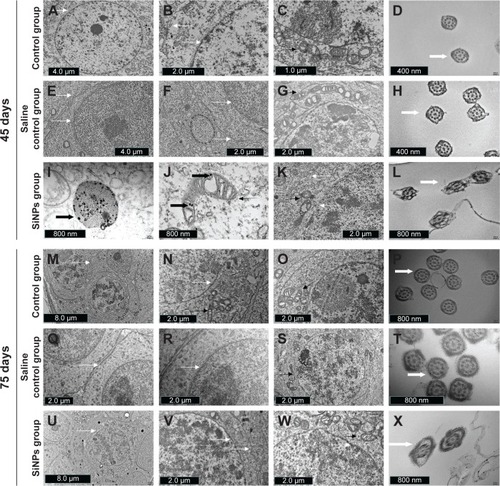
Figure 4 The effects of SiNPs on the quality and quantity of sperms in epididymides.
Notes: (A–C) SiNPs decreased the sperm concentration and the sperm motility, and increased the sperm abnormity on the 45th day after the first dose. (D–F) The sperm concentration, the sperm motility, and the sperm abnormity in the SiNPs group had no significant difference compared with the saline control group on the 75th day after the first dose. Data are expressed as the mean ± standard error from three independent experiments. *P<0.05 vs the saline control group. Saline group represents the saline control group. The data indicated that SiNPs could decrease the quality and quantity of sperms.
Abbreviation: SiNPs, silica nanoparticles.
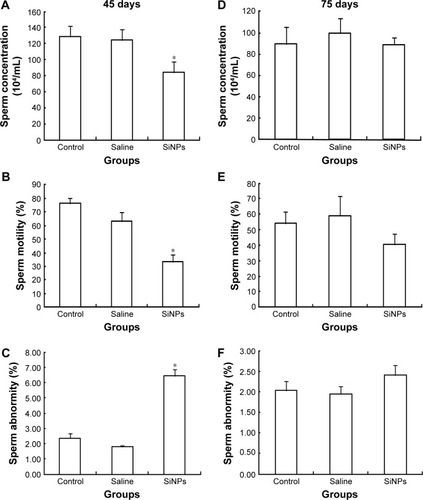
Figure 5 The effects of SiNPs on the apoptosis of spermatogenic cells in testis of mice.
Notes: (A–C) The apoptotic cells were confirmed by TUNEL in every group on the 45th day after the first dose. The apoptotic cells were observed by a fluorescence microscope. SiNPs increased the proportion of apoptosis cells. (D–F) The apoptotic cells were confirmed by TUNEL in every group on the 75th day after the first dose. The apoptosis in the SiNPs group and the saline control group displayed no significant difference on the 75th day after the first dose. The apoptosis of spermatogenic cells was detected by TUNEL assay. Data are expressed as the mean ± standard error from three independent experiments. *P<0.05 vs the saline control group. The white arrow represents the apoptosis of cells. Saline group represents the saline control group. The data indicated that SiNPs could increase the apoptosis of spermatogenic cells.
Abbreviations: SiNPs, silica nanoparticles; TUNEL, terminal deoxynucleotidyl transferase (TdT)-mediated dUTP nick-end labeling.
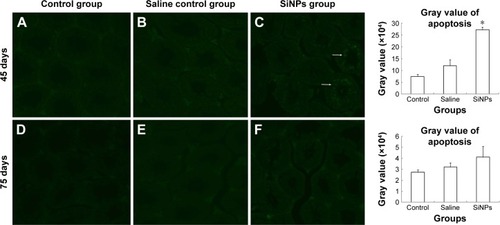
Figure 6 The effects of SiNPs on the oxidative stress in testis of mice.
Notes: (A, C, and E) SiNPs increased the level of SOD, MDA and 3-NT on the 45th day after the first dose. (B, D, and F) The level of SOD and 3-NT showed no significant difference between the SiNPs group and the saline control group on the 75th day after the first dose. The level of MDA in the SiNP group was higher than that in the saline control group on the 75th day after the first dose (P=0.048). Data are expressed as the mean ± standard error from three independent experiments. *P<0.05 vs the saline control group. Saline group represents the saline control group. The data indicated that SiNPs could increase the level of oxidative stress.
Abbreviations: SOD, superoxide dismutase; MDA, malondialdehyde; 3-NT, 3-nitrotyrosine; SiNPs, silica nanoparticles; prot, protein.
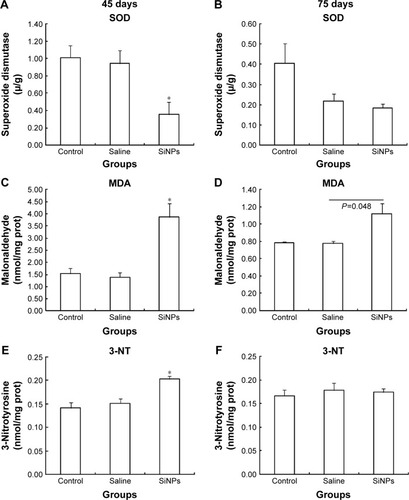
Figure 7 The effects of SiNPs on the expression of proteins in RIPK1 signal pathway at 45 days.
Notes: (A) The expression of RIPK1/FADD/caspase-8/cleaved caspase-8/caspase-3/cleaved caspase-3 and RIPK3/MLKL were measured by Western blot assay. (B) Relative densitometric analysis of protein bands were presented. After being exposed to SiNPs for 45 days, SiNPs upregulated the expressions of RIPK1/FADD/caspase-8/cleaved caspase-8/caspase-3/cleaved caspase-3 and RIPK3/MLKL. Data are expressed as the mean ± standard error from three independent experiments. *P<0.05 vs the saline control group. The data indicated that SiNPs could increase the expression of proteins in the RIPK1 signal pathway.
Abbreviations: SiNPs, silica nanoparticles; FasL, Fas ligand; C-caspase-8, cleaved caspase-8; C-caspase-3, cleaved caspase-3.
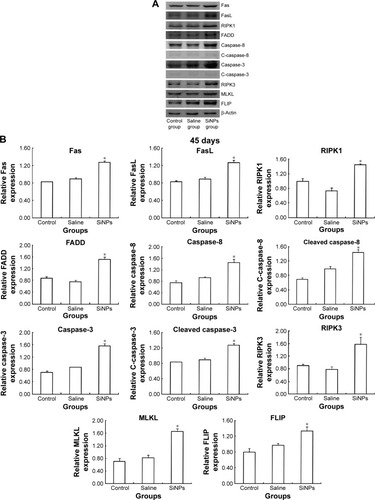
Figure 8 The effects of SiNPs on the expression of proteins in RIPK1 signal pathway at 75 days.
Notes: (A) The expression of RIPK1/FADD/caspase-8/cleaved caspase-8/caspase-3/cleaved caspase-3 and RIPK3/MLKL were measured by Western blot assay. (B) Relative densitometric analysis of protein bands were presented. After stopping exposure to SiNPs for 30 days, the effect of SiNPs on the expressions of RIPK1/FADD/caspase-8/cleaved caspase-8/caspase-3/cleaved caspase-3 and RIPK3/MLKL disappeared. Data are expressed as the mean ± standard error from three independent experiments. The data indicated that the effects of SiNPs on the expression of protein in the RIPK1 signal pathway disappeared after stopping exposure to SiNPs.
Abbreviations: SiNPs, silica nanoparticles; FasL, Fas ligand; C-caspase-8, cleaved caspase-8; C-caspase-3, cleaved caspase-3.
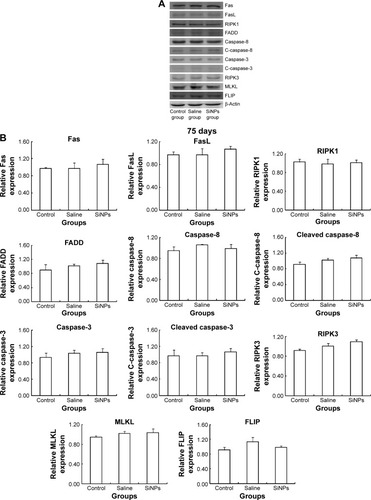
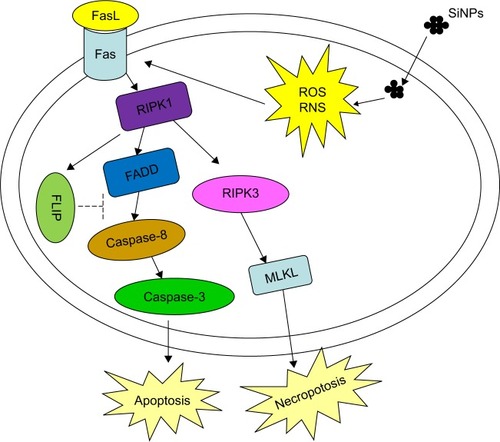
Figure 9 The possible mechanism of SiNPs on spermatogenic cells.
Abbreviations: SiNPs, silica nanoparticles; ROS, reactive oxygen species; RNS, reactive nitrogen species; FasL, Fas ligand.