Figures & data
Figure 1 Schematic illustration of the procedure for the fabrication of the CHI/ALG free-standing nanomembrane and the formation of the cell free-standing nanomembrane complex.
Notes: (A) Solidified gelatin solution as the substrate; (B) LBL deposition of CHI and ALG; (C) the CHI/ALG nanomembrane became free-standing as the substrate melted in 37°C water; (D) the gelatin-supported nanomembrane was sterilized with UV light for 2 hours before cell seeding; (E) the cells seeded on the surface of the complex; (F) the gelatin block gradually melted in the 37°C incubator; (G) the cell free-standing nanomembrane formed; (H) graphical representation for the experiments.
Abbreviations: ALG, alginate; BMSCs, bone marrow stem cells; CHI, chitosan; FACS, fluorescence-activated cell sorting; H&E, hematoxylin and eosin; LBL, layer by layer; UV, ultraviolet.
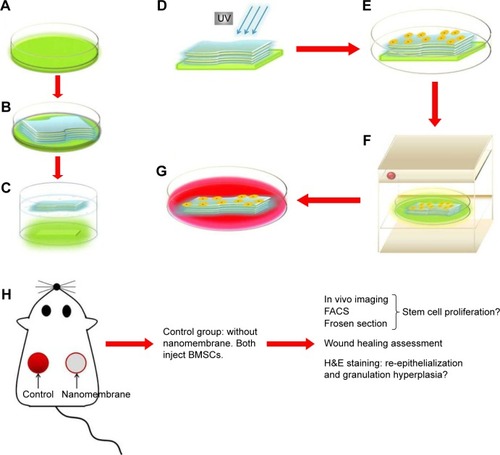
Figure 2 Observation of the free-standing CHI/ALG nanomembrane.
Notes: (A) Free-standing CHI/ALG nanomembrane floating in PBS buffer (top) under UV light (below); (B) SEM of the nanomembrane. Scale bar: 10 µm. (C) Water contact angles of the different layers; (D) TEM of the nanomembrane. The thickness between two adjacent layers was ∼200 nm (as indicated by the black bar), and the entire thickness was proportional to the number of deposited layers. Scale bar: 500 nm.
Abbreviations: ALG, alginate; CHI, chitosan; PBS, phosphate-buffered saline; SEM, scanning electron microscopy; TEM, transmission electron microscopy; UV, ultraviolet.
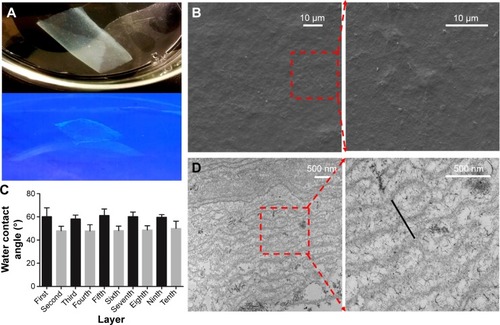
Figure 3 Cell adhesion and proliferation on the membrane.
Notes: (A) Live/dead assay of the BMSCs that were cultured on the CHI/ALG free-standing nanomembrane after 3 days. The arrows represent the dividing cells. Scale bar: 100 µm. (B) MTT assay of cells culturing on the nanomembrane and 96-well plate at 0 hour, 24 hours, 48 hours, and 72 hours; (C) SEM image of the MSCs that were cultured on the nanomembrane after 3 days. Scale bar: 10 µm.
Abbreviations: ALG, alginate; BMSCs, bone marrow stem cells; CHI, chitosan; MSCs, mesenchymal stem cells; MTT, 3-(4,5-dimethylthiazol-2-yl)-2,5-diphenyltetrazolium bromide; SEM, scanning electron microscopy.
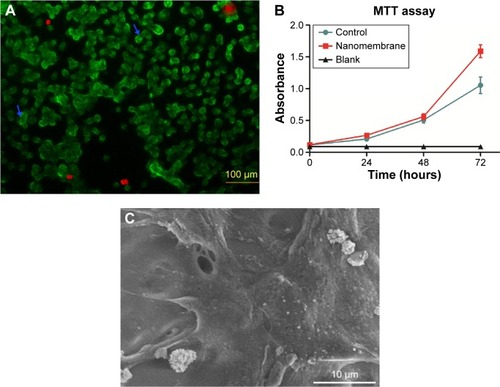
Figure 4 In vivo images of the GFP-MSCs on the mouse dorsal skin wounds.
Notes: (A) Fluorescent signal of the GFP-MSCs in the control group at day 7; (B) fluorescent signal of the GFP-MSCs in the experimental group at day 7. Scale bar: 1 cm. (C) Fluorescent signal quantification: the average signal intensity in the control group was 6.00±2.84 (×104), whereas in the nanomembrane group, it was 25.97±6.98 (×104). P<0.05.
Abbreviations: GFP, green fluorescent protein; MSCs, mesenchymal stem cells.
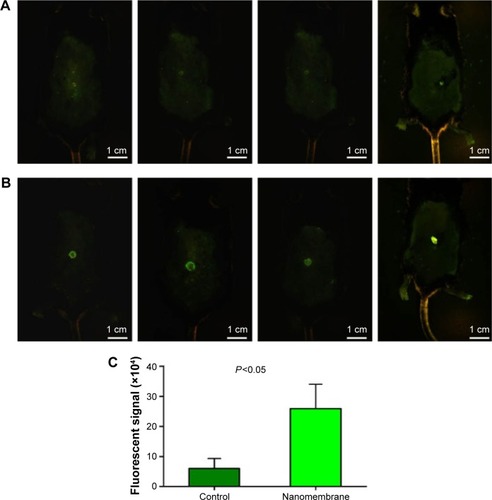
Figure 5 Positive GFP-MSC ratio detection using FACS.
Notes: (A) BL1 and BL3 represented the two different markers for GFP and 7-AAD, respectively. Q1: GFP+ and 7-AAD−: living GFP-MSCs; Q2: GFP+ and 7-AAD+: dead GFP-MSCs; Q3: GFP− and 7-AAD+: dead non-GFP cells; Q4: GFP− and 7-AAD−: living non-GFP cells; (B) percentage of living cells detected by FACS: Q1 + Q4/Q1 + Q2 + Q3 + Q4 × 100%; (C) percentage of positive GFP-MSCs in the living cells: Q1/Q1 + Q4 × 100%; (D) and (E) average percentage of positive GFP-MSCs in all the living cells in the two groups at days 5 and 7 post surgery.
Abbreviations: FACS, fluorescence-activated cell sorting; GFP, green fluorescent protein; MSCs, mesenchymal stem cells; 7-AAD, 7-aminoactinomycin D.
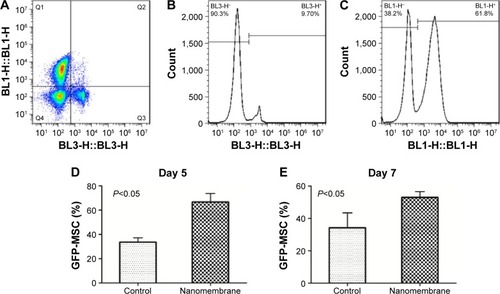
Figure 6 Observation of the frozen sections.
Notes: (A) Engraftment of the GFP-MSCs into the wounds of the control group; (B) engraftment of the GFP-MSCs into the wounds of the nanomembrane group. Both tissue sections of the wounds in the two groups were immunostained with an antibody against GFP at day 7 after surgery. MSC-GFPs (green) were engrafted into the newly formed tissue. The nuclei were stained with DAPI (blue). Scale bar: 100 µm. (C) Average GFP-MSC counts for the two groups. P<0.05.
Abbreviations: DAPI, 4′,6-diamidino-2-phenylindole; GFP, green fluorescent protein; MSC, mesenchymal stem cell.
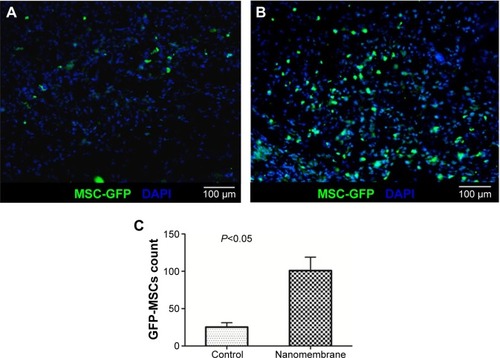
Figure 7 The macroscopic appearance of the wounds in the four groups at different time points post surgery.
Notes: (A) Control; (B) nanomembrane; (C) BMSCs; and (D) nanomembrane + BMSCs group; (E) the ratio of the left wound in every group at different time points from day 0 to day 9. *Indicates that the P-value was less than 0.05.
Abbreviation: BMSCs, bone marrow stem cells.
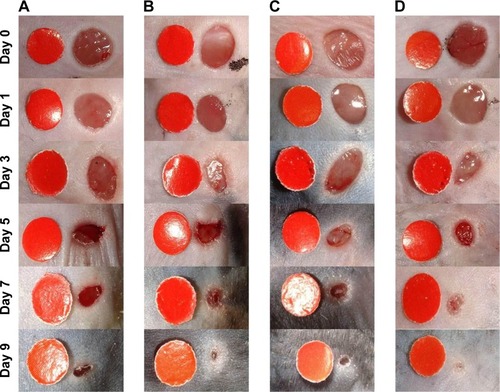
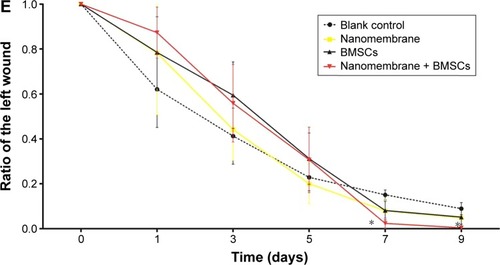
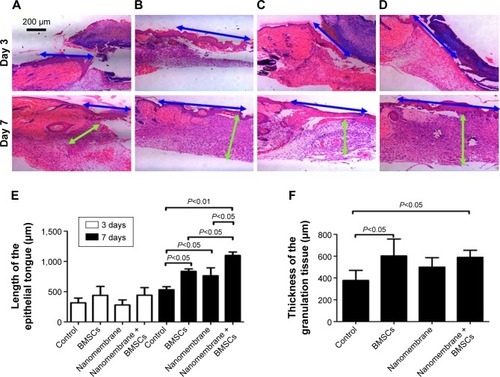
Figure 8 Length of the newly formed epithelium and the thickness of the granulation tissue post surgery.
Notes: (A) Control; (B) BMSCs; (C) nanomembrane; (D) nanomembrane + BMSCs; (E) the length of the epithelium tongue in each group at days 3 and 7; (F) the thickness of the granulation tissue in each group at day 7. Values are the mean ± SD (n=5). The blue arrow indicates the length of the epithelium tongue and the green arrow indicates the thickness of the granulation tissue.
Abbreviation: BMSCs, bone marrow stem cells.