Figures & data
Figure 1 GNPs characterization.
Notes: (A) Peak absorption of prepared GNPs (1.2) at 535 nm wavelength. (B) TEM images showing gold nanospheres with average 18 nm diameter (magnification, 97,000×). (C) Particle size distribution by zeta sizer showing peak percent (22.9%) at 18 nm diameter. (D) EDX showing peaks corresponding to Au element at 2.12 keV, 9.44 keV, and 11.4 keV, confirming the existence of GNPs.
Abbreviations: EDX, energy-dispersive X-ray spectroscopy; GNPs, gold nanoparticles; TEM, transmission electron microscopy; Abs, absorbance.
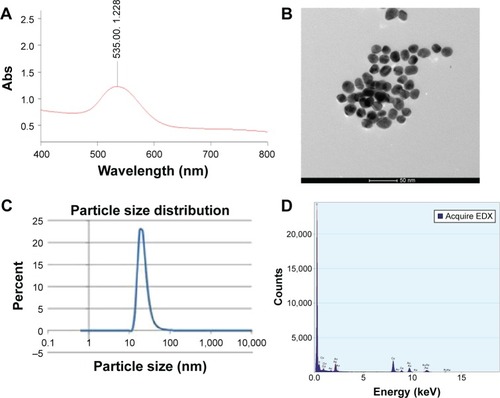
Table 1 Mean ± SD of clinical hematology, clinical chemistry, and tissue distribution data
Figure 2 Liver and kidneys of hamsters of the injected group.
Notes: (A) Liver of a hamster of the injected group showing marked vacuolar degeneration of hepatocytes and congestion of hepatic blood vessels (hematoxylin and eosin stain [H&E], magnification, ×20). (B) Liver of a hamster of the injected group showing perivascular mononuclear cell infiltration (H&E, ×20). (C) Liver of a hamster of the injected group showing sporadic foci of hepatic necrosis scattered throughout the hepatic parenchyma along with replacement of the necrotic tissue with mononuclear cells (H&E, ×20). (D) Liver of a hamster of the injected group showing paracentral area of coagulative necrosis of hepatocytes with mononuclear cell infiltration (H&E, ×20). (E) Liver of a hamster of the injected group showing focal areas of hepatic necrosis and sinusoidal leukocytosis (H&E, ×20). (F) Kidney of a hamster of the injected group showing marked vacuolar degeneration and necrosis of tubular epithelium associated with thickening of the tubular and glomerular basement membranes, swelling of glomerular tuft, congestion of intertubular blood vessels, and intertubular hemorrhage (H&E, ×40).
![Figure 2 Liver and kidneys of hamsters of the injected group.Notes: (A) Liver of a hamster of the injected group showing marked vacuolar degeneration of hepatocytes and congestion of hepatic blood vessels (hematoxylin and eosin stain [H&E], magnification, ×20). (B) Liver of a hamster of the injected group showing perivascular mononuclear cell infiltration (H&E, ×20). (C) Liver of a hamster of the injected group showing sporadic foci of hepatic necrosis scattered throughout the hepatic parenchyma along with replacement of the necrotic tissue with mononuclear cells (H&E, ×20). (D) Liver of a hamster of the injected group showing paracentral area of coagulative necrosis of hepatocytes with mononuclear cell infiltration (H&E, ×20). (E) Liver of a hamster of the injected group showing focal areas of hepatic necrosis and sinusoidal leukocytosis (H&E, ×20). (F) Kidney of a hamster of the injected group showing marked vacuolar degeneration and necrosis of tubular epithelium associated with thickening of the tubular and glomerular basement membranes, swelling of glomerular tuft, congestion of intertubular blood vessels, and intertubular hemorrhage (H&E, ×40).](/cms/asset/cdfe39dc-a10f-49c5-abee-3c238addac31/dijn_a_102919_f0002_c.jpg)
Figure 3 Kidneys of hamsters of the injected group.
Notes: (A) Kidney of a hamster of the injected group showing marked vacuolar degeneration and necrosis of tubular epithelium together with an increased mesangial matrix and hyalinization of glomerular tuft and tubular basement membrane (hematoxylin and eosin stain [H&E], magnification, ×40). (B) Kidney of a hamster of the injected group showing focal interstitial mononuclear cell infiltration (H&E, ×40).
![Figure 3 Kidneys of hamsters of the injected group.Notes: (A) Kidney of a hamster of the injected group showing marked vacuolar degeneration and necrosis of tubular epithelium together with an increased mesangial matrix and hyalinization of glomerular tuft and tubular basement membrane (hematoxylin and eosin stain [H&E], magnification, ×40). (B) Kidney of a hamster of the injected group showing focal interstitial mononuclear cell infiltration (H&E, ×40).](/cms/asset/5fb3a3d5-d9d6-4fc9-ae7d-21e5ed50a087/dijn_a_102919_f0003_c.jpg)
Table 2 Scoring of histopathological lesions in the liver of 18 nm GNP-injected hamsters
Table 3 Scoring of histopathological lesions in the kidney of 18 nm GNP-injected hamsters
Table 4 Mean ± SD scores of lesions in livers of 18 nm GNPs- injected hamsters
Table 5 Mean ± SD scores of lesions in kidneys of 18 nm GNPs-injected hamsters
Figure 4 Scoring of hepatic histopathological lesions after I/P injection of 18 nm GNPs in Syrian golden hamsters for 14 consecutive days.
Abbreviations: GNPs, gold nanoparticles; I/P, intraperitoneal.
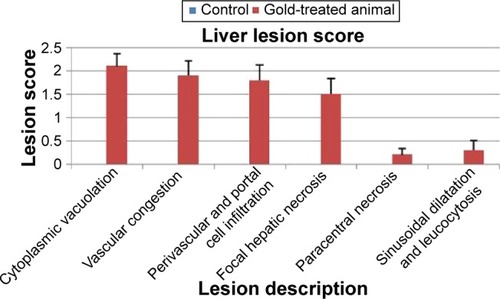
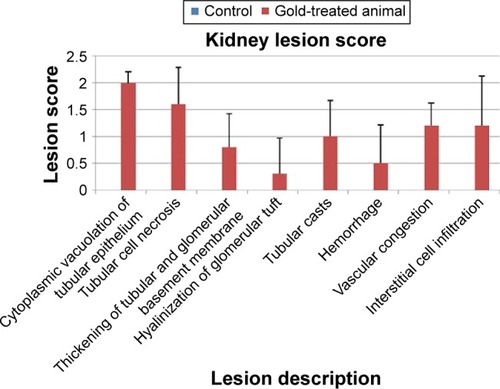
Figure 5 Scoring of renal histopathological lesions after I/P injection of 18 nm GNPs in Syrian golden hamsters for 14 consecutive days.
Abbreviations: GNPs, gold nanoparticles; I/P, intraperitoneal.