Figures & data
Figure 1 A schematic illustration for the synthesis, drug loading, and surface modification of nanoparticles.
Abbreviations: MCNs, mesoporous carbon nanospheres; oMCN@DOX@PEG, polyethylene glycol-modified doxorubicin-loaded oxidized mesoporous carbon nanospheres; DSPE-mPEG, 1,2-distearoyl-sn-glycero-3-phosphoethanolamine-N-(methoxy[polyethylene glycol]-2000); oMCN@DOX, doxorubicin-loaded oxidized mesoporous carbon nanospheres; DOX, doxorubicin; oMCNs, oxidized mesoporous carbon nanospheres.
![Figure 1 A schematic illustration for the synthesis, drug loading, and surface modification of nanoparticles.Abbreviations: MCNs, mesoporous carbon nanospheres; oMCN@DOX@PEG, polyethylene glycol-modified doxorubicin-loaded oxidized mesoporous carbon nanospheres; DSPE-mPEG, 1,2-distearoyl-sn-glycero-3-phosphoethanolamine-N-(methoxy[polyethylene glycol]-2000); oMCN@DOX, doxorubicin-loaded oxidized mesoporous carbon nanospheres; DOX, doxorubicin; oMCNs, oxidized mesoporous carbon nanospheres.](/cms/asset/4a6ea353-e5c6-4d89-8a4e-fcecebb53bbb/dijn_a_103020_f0001_c.jpg)
Figure 2 Characterizations of functional groups.
Notes: (A) FTIR spectra of MCNs, oMCNs, and oMCN@PEG. (B) 1H-NMR spectra of oMCNs and oMCN@PEG in DMSO-d6.
Abbreviations: FTIR, Fourier transform infrared; MCNs, mesoporous carbon nanospheres; oMCNs, oxidized mesoporous carbon nanospheres; oMCN@PEG, polyethylene glycol-modified oxidized mesoporous carbon nanospheres; 1H-NMR, 1H-nuclear magnetic resonance; DMSO, dimethylsulfoxide.
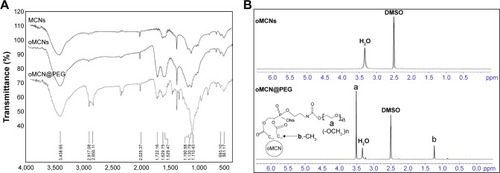
Figure 3 TEM images of nanoparticles.
Notes: (A) MCNs, insert HRTEM of MCNs; (B) oMCNs, insert HRTEM of oMCNs; and (C) oMCN@PEG, insert HRTEM of oMCN@PEG.
Abbreviations: TEM, transmission electron microscope; MCNs, mesoporous carbon nanospheres; HRTEM, high-resolution transmission electron microscopy; oMCNs, oxidized mesoporous carbon nanospheres; oMCN@PEG, polyethylene glycol-modified oxidized mesoporous carbon nanospheres.
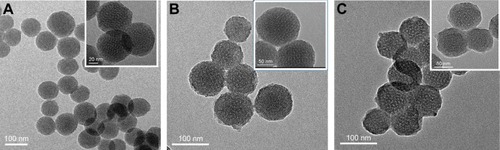
Table 1 Structure parameters for the synthesized MCNs and oMCNs samples
Figure 4 Structure analysis of samples.
Notes: (A) SAXS patterns and (B) nitrogen adsorption–desorption isotherms, insert pore size distribution curves of the samples. ”q” refers to scattering vector.
Abbreviations: SAXS, small-angle X-ray scattering; MCNs, mesoporous carbon nanospheres; oMCNs, oxidized mesoporous carbon nanospheres; au, arbitrary STP, standard temperature and pressure; Ln I, natural logarithm of intensity.
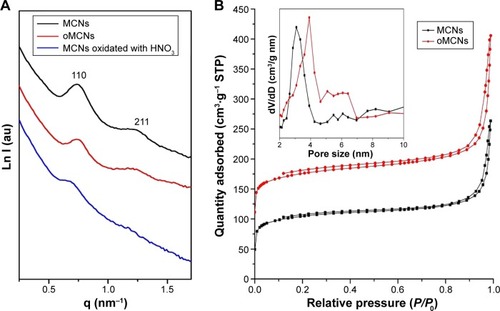
Figure 5 Typical DLS profile of nanoparticles measured in aqueous solution.
Notes: (A) Hydrodynamic diameters. (B) Zeta potential measurements of nanoparticles. (C) Photos of MCNs and oMCN@PEGredispersed in PBSwith Tyndall phenomenon.
Abbreviations: DLS, dynamic light scattering; MCNs, mesoporous carbon nanospheres; oMCNs, oxidized mesoporous carbon nanospheres; oMCN@PEG, polyethylene glycol-modified oxidized mesoporous carbon nanospheres; PBS, phosphate buffer solution.
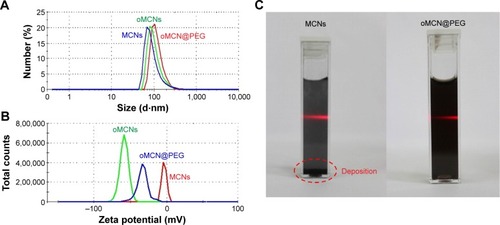
Figure 6 Drug loading and release process.
Notes: (A) Raman spectra of MCNs before and after oxidation. (B) UV–Vis spectra of free DOX and oMCN@DOX; structure of DOX is insert. Comparison of drug-loading efficiency of (C) MCNs before and after modification, (D) different pH values of PBS, and (E) different weight ratios of DOX to oMCNs. (F) Release profile of oMCN@DOX@PEG against different pH values.
Abbreviations: MCNs, mesoporous carbon nanospheres; UV–Vis, ultraviolet visible; DOX, doxorubicin; oMCN@DOX, doxorubicin-loaded oxidized mesoporous carbon nanospheres; pH, potential of hydrogen; PBS, phosphate buffer solution; oMCNs, oxidized mesoporous carbon nanospheres; oMCN@DOX@PEG, polyethylene glycol-modified doxorubicin-loaded oxidized mesoporous carbon nanospheres; au, arbitrary unit; h, hours.
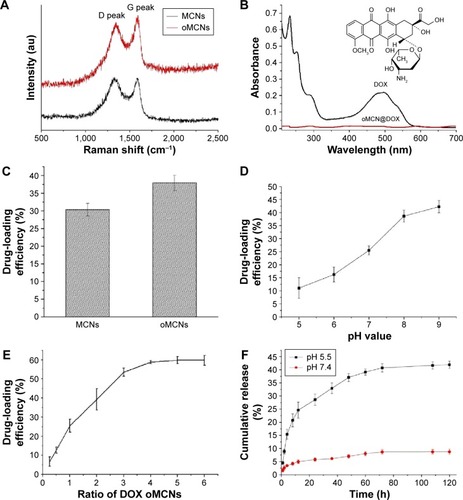
Figure 7 Fluorescent images of LLC cells after co-incubation with 10 μg/mL of oMCN@DOX@PEG at 37°C for 1 h.
Notes: (A) Bright-field image, (B) DOX, (C) nuclei, and (D) merging images. (E–G) Fluorescent images of LLC cells incubated with oMCN@DOX@PEG with the equivalent DOX concentration (~5 μg/mL calculated by the drug-loading efficiency) taken at 0.5 h, 1 h and 2 h, respectively. (H) Fluorescent images of LLC cells incubated with 5 μg/mL of DOX for 1 h; the fluorescence is much weaker than that of F. The scale bar is 50 μm.
Abbreviations: LLC, Lewis lung carcinoma; oMCN@DOX@PEG, polyethylene glycol-modified doxorubicin-loaded oxidized mesoporous carbon nanospheres; h, hours; DOX, doxorubicin.
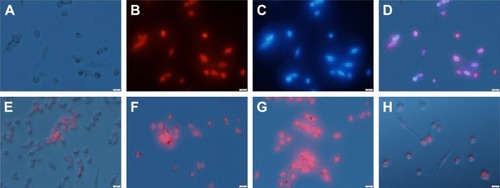
Figure 8 Viability of (A) L929, (B) Hela, and (C) LLC cells after 24 h or 48 h of incubation with different concentrations of oMCN@PEG. Cytotoxicity of LLC cells incubated with free DOX and oMCN@DOX@PEG after (D) 24 h and (E) 48 h.
Abbreviations: L929, fibroblast line 929; LLC, Lewis lung carcinoma; h, hours; oMCN@PEG, polyethylene glycol-modified oxidized mesoporous carbon nanospheres; DOX, doxorubicin; oMCN@DOX@PEG, polyethylene glycol-modified doxorubicin-loaded oxidized mesoporous carbon nanospheres.
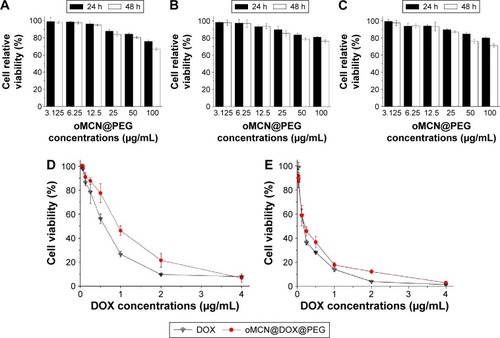
Figure 9 Apoptosis of LLCcells induced by oMCN@PEG and oMCN@DOX@PEG.
Notes: LLC cells were stimulated with 0.5 μg/mL, 5 μg/mL, and 20 μg/mLof oMCN@PEG and 0.25 μg/mL, 0.5 μg/mL, 1 μg/mL, and 2 μg/mL of oMCN@PEG@DOX for 12 h. Apoptosis was then quantified by FACS after staining with Annexin V and PI. The results are presented as fold changes compared with corresponding control cells.
Abbreviations: LLC, Lewis lung carcinoma; oMCN@PEG, polyethylene glycol-modified oxidized mesoporous carbon nanospheres; oMCN@DOX@PEG, polyethylene glycol-modified doxorubicin-loaded oxidized mesoporous carbon nanospheres; h, hours; FACS, fluorescence-activated cell sorter; PI, propidium iodide.
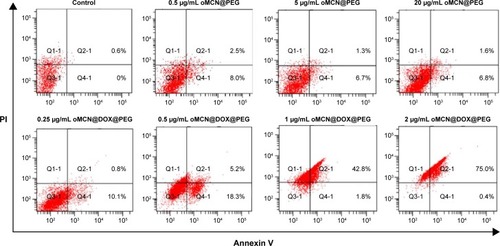
Table 2 Pharmacokinetic parameters of DOX after iv injection of free DOX, oMCN@DOX, or oMCN@DOX@PEG to Sprague Dawley rats via tail vein
Figure 10 Mean plasma concentration of DOX after iv injection of free DOX, oMCN@DOX, or oMCN@DOX@PEG to Sprague Dawley rats via tail vein at a dose of 8 mg/kg (n=6).
Abbreviations: DOX, doxorubicin; iv, intravenous; oMCN@DOX, doxorubicin-loaded oxidized mesoporous carbon nanospheres; oMCN@DOX@PEG, polyethylene glycol-modified doxorubicin-loaded oxidized mesoporous carbon nanosphere; h, hours; lg C, logarithm of concentration.
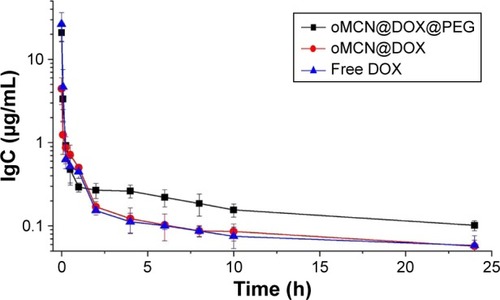
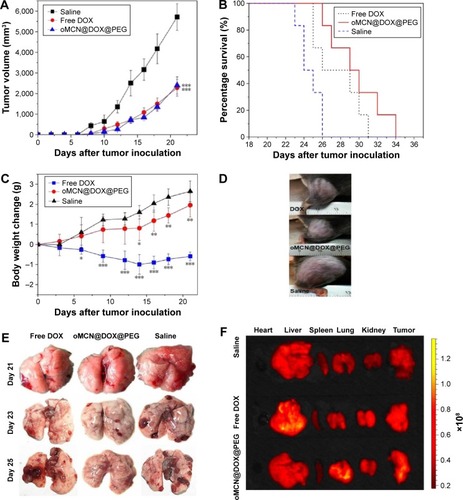
Figure 11 In vivo therapy of free DOX, oMCN@DOX@PEG, and saline on LLC model.
Notes: (A) The growth curves of primary tumor; (B) survival time curves, (C) body weight, and (D) typical photos of tumor size in the right hind legs of C57BL/6N mice bearing LLC treated with free DOX, oMCN@DOX@PEG (2.5 mg/kg), and saline. Six mice per group were used. Data are presented as mean ± SD. (E) Lungs from the tumor-bearing mice treated with free DOX, oMCN@DOX@PEG, and saline were removed and visually examined for the number of metastatic tumor nodules on days 21, 23, and 25. (F) Ex vivo fluorescence images of excised organs and tumors at 12 h post injection of the formulations. *P<0.05 vs saline, **P<0.01 vs saline, and ***P<0.001 vs saline (n=6).
Abbreviations: DOX, doxorubicin; oMCN@DOX@PEG, polyethylene glycol-modified doxorubicin-loaded oxidized mesoporous carbon nanospheres; LLC, Lewis lung carcinoma; SD, standard deviation.