Figures & data
Figure 1 Representative surgical procedure of TRR and laser exposure.
Notes: (A) The peritendon transaction to create a rupture. (B) The Achilles tendon was sutured back. (C) Injection of GNRs-1/curc@PMs solution. (D and E) The incision was stitched, and the lag was splinted by plastic plates. (F) NIR exposure.
Abbreviations: TRR, tendon rupture and repair; NIR, near-infrared.
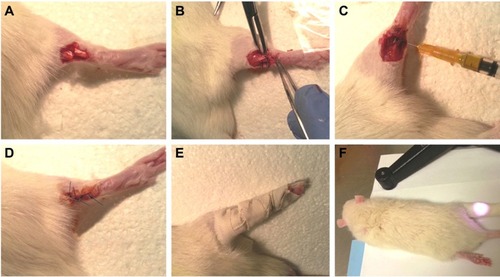
Figure 2 GNRs-1/curc@PMs characterization.
Notes: (A) DLS analysis. (B) TEM analysis (scale bar =200 nm). (C) UV–vis analysis.
Abbreviations: DLS, dynamic light scattering; TEM, transmission electron microscopy; TPR, transverse plasmon resonance; LPR, longitudinal plasmon resonance.
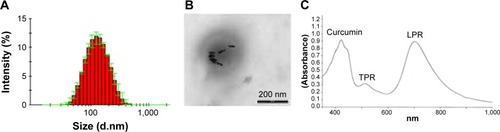
Figure 3 Representative gross anatomy after treatments and laser exposure.
Notes: (A) GNRs-1/curc@PMs + laser group. (B) Curcumin group. (C) Saline group. (D) Macroscopic peritendinous adhesion scoring: *P<0.01 vs curcumin group and #P<0.01 vs saline group. Student’s t-tests assuming unequal variance were performed. The results were expressed as mean values ± standard deviation.
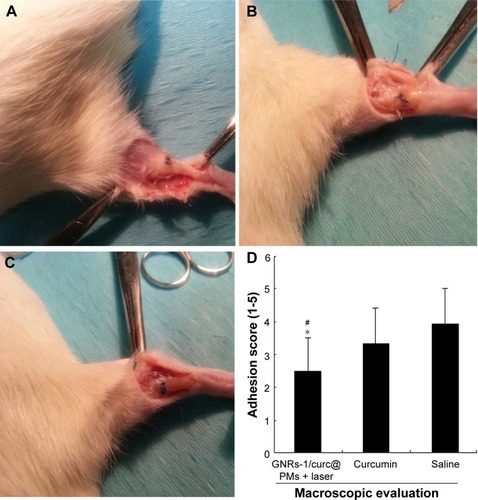
Figure 4 Biomechanical evaluation on Achilles tendon that underwent TRR.
Note: *P<0.01 vs curcumin group and #P<0.01 vs saline group. Student’s t-tests assuming unequal variance were performed. The results were expressed as mean values ± standard deviation. Plots show evaluation of tensile strength in three groups (A) and the evaluation of toughness in three groups (B).
Abbreviation: TRR, tendon rupture and repair.
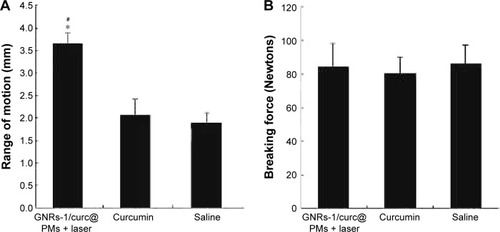
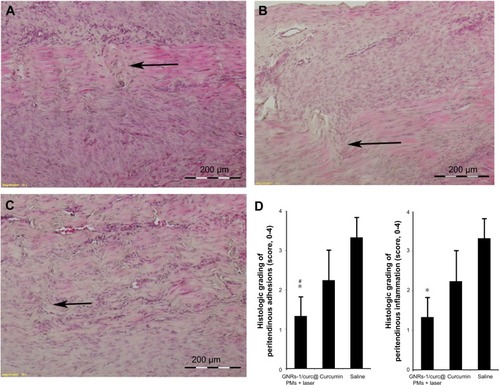
Figure 5 Representative histology after treatments and laser exposure.
Notes: (A) GNRs-1/curc@PMs + laser group. (B) Curcumin group. (C) Saline group. Arrow: tendon healing site. (D) Histological grading of peritendinous adhesion and inflammation: *P<0.01 vs curcumin group and #P<0.01 vs saline group. Student’s t-tests assuming unequal variance were performed. The results were expressed as mean values ± standard deviation.