Figures & data
Figure 1 In vitro release profiles of DXMA from DXMA-NLCs and free DXMA (mean ± SD, n = 3).
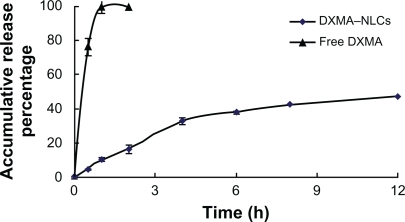
Figure 2 Differential scanning calorimetry (DSC) of Blank NLCs (A), DXMA-NLCs (B), physical mixture of blank NLCs and DXMA (C), and DXMA (D).
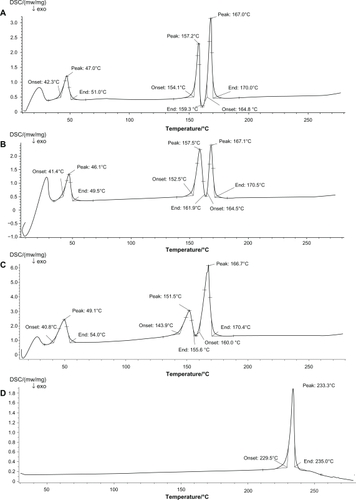
Figure 3 The 31P NMR spectrums of DXMA, blank NLCs, DXMA-NLCs, and physical mixture of blank NLCs and DXMA.
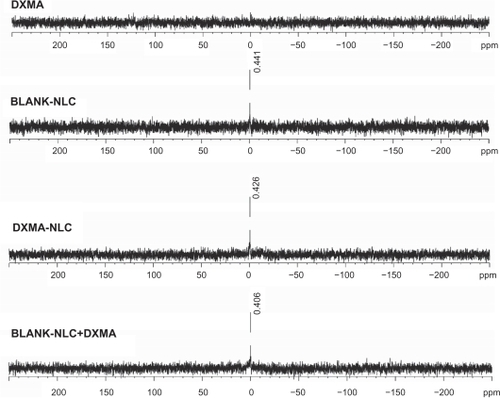
Figure 4 DXMA concentrations in plasma and tissues at different time points after i.v. administration of DXMA-NLCs and DXMA-sol.
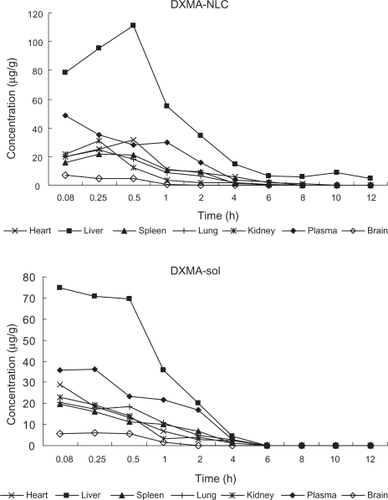
Table 1 Percentage of TAD of DXMA in plasma and tissues after iv administration of DXMA-NLCs (A) and DXMA-sol (B) in mice
Table 2 The pharmacokinetic parameters of DXMA-NLCs (A) and DXMA-sol (B) in tissues and plasma
Figure 5 The edema value (cm) of DXMA-NLCs and DXMA-sol on carrageenan induced paw edema in rats.
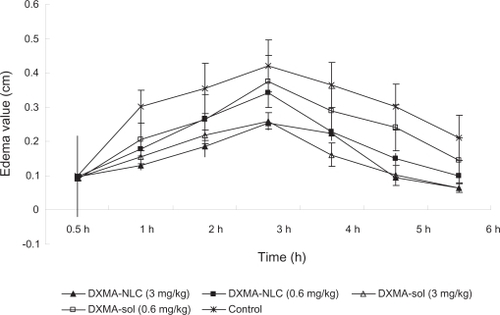
Table 4 Serum values of AKP, AST, and ALT in CCl4 induced rats after administration of drugs
Table 3 Liver coefficient and hydroxyproline (Hyp) content of CCl4 induced rats after administration of drugs