Figures & data
Figure 1 Illustration of sorafenib-loaded nanomedicines.
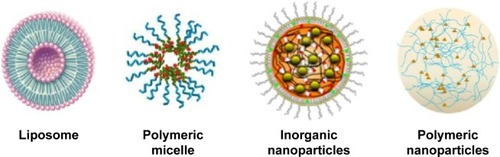
Figure 2 Characterization of sorafenib-LNS.
Notes: (A) Particle size and size distribution, (B) TEM images: level of magnification of the left image is 19,000×; the right image magnification is 70,000×; (C) zeta potential, (D) photograph of lyophilized sorafenib-LNS, and (E) photograph of lyophilized sorafenib-LNS after redispersion.
Abbreviations: Sorafenib-LNS, sorafenib-loaded lipid-based nanosuspensions; TEM, transmission electron microscopy.
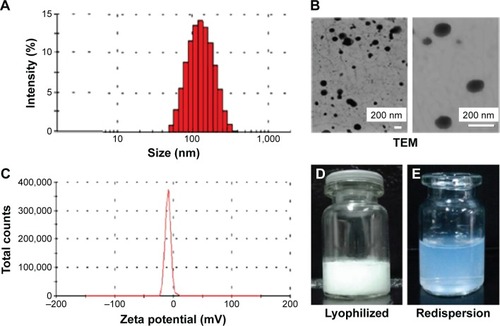
Figure 3 In vitro release profile of sorafenib in PBS (1.0% Tween-80, pH =7.4) at 37°C±0.5°C.
Note: Data are mean ± SD (n=3).
Abbreviations: PBS, phosphate-buffered saline; sorafenib-LNS, sorafenib-loaded lipid-based nanosuspensions.
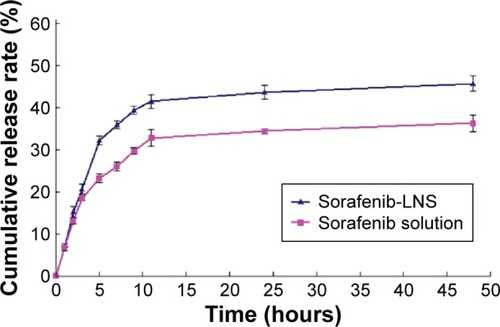
Figure 4 Particle size changes of sorafenib-LNS incubated in 100% or 20% serum at 37°C for 60 hours.
Abbreviation: Sorafenib-LNS, sorafenib-loaded lipid-based nanosuspensions.
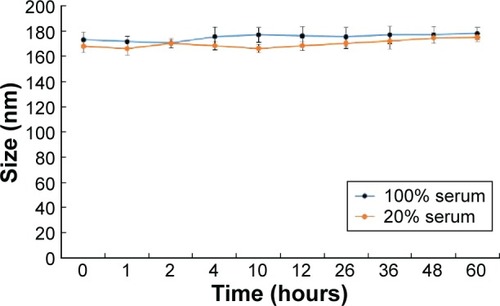
Table 1 The IC50 of sorafenib solution, sorafenib-LNS, and blank-LNS for HepG2 and Bel-7402 cells after 48 hours incubation
Figure 5 Effects of different treatments on cell viabilities (percentage from untreated control) of HepG2 cells and Bel-7402 cells.
Notes: (A) Effect of concentrations of solvents (Cremophor EL–ethanol, 1:1, v/v) on cell viabilities of HepG2 and Bel-7402 cells; (B) effect of blank-LNS on cell viabilities of HepG2 cells and Bel-7402 cells; (C) effect of sorafenib solution (Cremophor EL–ethanol, 1:1, v/v, diluted in PBS) or sorafenib-LNS on cell viabilities of HepG2 cells; and (D) effect of sorafenib solution (Cremophor EL–ethanol, 1:1, v/v, diluted in PBS) or sorafenib-LNS on cell viabilities of Bel-7402 cells. Data are presented as the mean ± SD (n=3). *P<0.05 and **P<0.01.
Abbreviations: blank-LNS, blank lipid-based nanosuspensions; PBS, phosphate-buffered saline; sorafenib-LNS, sorafenib-loaded lipid-based nanosuspensions.
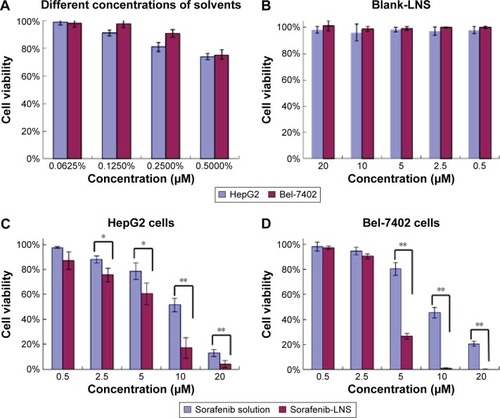
Figure 6 Mean tissue concentrations of sorafenib after a single IV injection in mice.
Notes: (A) Mean tissue concentrations of sorafenib after a single IV injection of sorafenib solution (Cremophor EL–ethanol, 1:1, v/v, diluted with normal saline) in mice and (B) mean tissue concentrations of sorafenib after a single IV injection of sorafenib-LNS in mice. Data are presented as the mean ± SD (n=3).
Abbreviations: IV, intravenous; sorafenib-LNS, sorafenib-loaded lipid-based nanosuspensions.
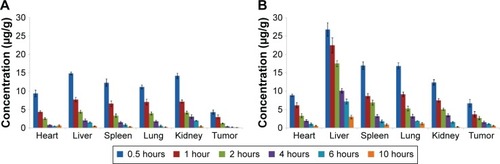
Table 2 Targeting disposition of sorafenib after intravenous administration of free sorafenib and sorafenib-LNS to mice (n=3)
Figure 7 Distribution of sorafenib in liver and tumor tissues after IV administration of sorafenib or sorafenib-LNS to mice.
Notes: (A) Distribution of sorafenib in liver after IV administration of sorafenib or sorafenib-LNS to mice and (B) distribution of sorafenib in tumor tissues after IV administration of sorafenib or sorafenib-LNS to mice. Data are presented as the mean ± SD (n=3). *P<0.05; **P<0.01.
Abbreviations: IV, intravenous; sorafenib-LNS, sorafenib-loaded lipid-based nanosuspensions.
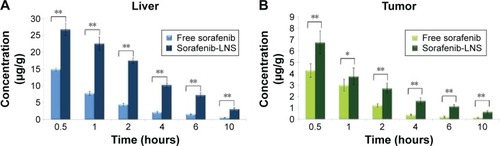
Figure 8 Real-time NIRF images of H22 tumor-bearing mice post-IV injection of free DiR and DiR-LNS.
Notes: At 1 hour, 2 hours, 4 hours, 6 hours, 10 hours, 24 hours, and 48 hours postadministration, mice were anesthetized with 10% chloral hydrate (IP) and then placed on their back in a light-tight chamber. The real-time NIRF images were taken using the Xenogen IVIS Lumina system with an ICG filter (excitation at 745 nm and emission at 835 nm). The tumors are circled in red.
Abbreviations: DiR, 1,1′-dioctadecyl-3,3,3′,3′-tetramethylindotricarbocyanine iodide; DiR-LNS, DiR-loaded lipid-based nanosuspensions; ICG, indocyanine green; IP, intraperitoneal; IV, intravenous; NIRF, near-infrared fluorophore.
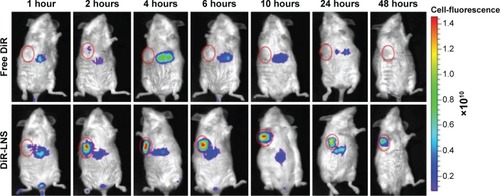
Figure 9 Antitumor efficacy of sorafenib in different formulations in H22 tumor-bearing mice (n=5).
Notes: (A) Schematic of in vivo pharmacodynamic experiments in Kunming mice implanted with H22 tumor cells; (B) time-dependent tumor growth profile of tumor-bearing mice administrated with NS, sorafenib solution (18 mg/kg, oral), sorafenib solution (9 mg/kg, IV), and sorafenib-LNS (9 mg/kg, IV); (C) excised tumor images after tumor therapy; (D) tumor weights after the administration of different formulations; and (E) body weight change after the administration of different formulations in H22 tumor-bearing mice. Data are presented as the mean ± SD (n=6). *P<0.05 and **P<0.01.
Abbreviations: IV, intravenous; NS, normal saline; sorafenib-LNS, sorafenib-loaded lipid-based nanosuspensions; sc, subcutaneous injection.
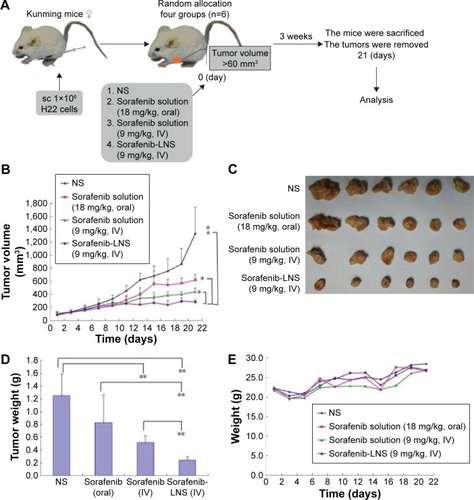
Figure 10 Photomicrographs of pathological sections of rabbit ear-rim vein after different treatments.
Notes: Two parts of the ear vein were obtained for histopathological examination, including the region 1 cm (proximal region) and 2 cm (distal region) from the pinprick. Magnification 100×.
Abbreviations: NS, normal saline; sorafenib-LNS, sorafenib-loaded lipid-based nanosuspensions.
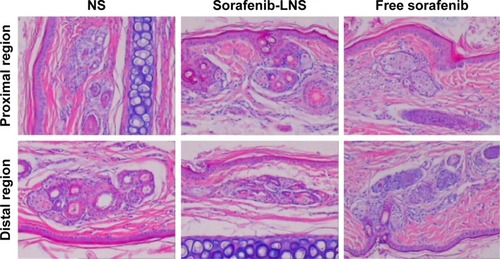
Figure 11 Representative microscopy images of H&E-stained histological sections after treatment with NS, blank-LNS, or sorafenib-LNS.
Note: Magnification 40×.
Abbreviations: blank-LNS, blank lipid-based nanosuspensions; H&E, hematoxylin and eosin; NS, normal saline; sorafenib-LNS, sorafenib-loaded lipid-based nanosuspensions.
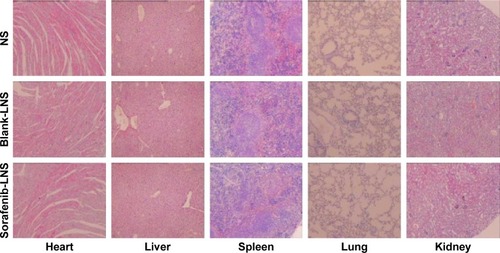
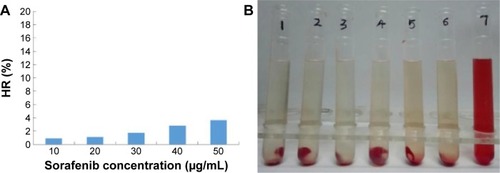
Figure 12 In vitro hemolysis assay of sorafenib-LNS.
Notes: (A) HR of the sorafenib-LNS at different sorafenib concentrations and (B) photograph of hemolysis samples for sorafenib-LNS. Sample 1: negative control (NS); Samples 2–6: five different concentrations of sorafenib-LNS from low to high; and Sample 7: positive control.
Abbreviations: HR, hemolysis ratio; NS, normal saline; sorafenib-LNS, sorafenib-loaded lipid-based nanosuspensions.