Figures & data
Table 1 The PLA–10R5–PLA copolymers synthesized in this work
Figure 1 Synthesis and characterization of PLA-10R5-PLA copolymer.
Notes: (A) Synthesis scheme of the PLA–10R5–PLA block copolymer; (B) FTIR spectrum (KBr) of reverse pluronic®10R5 (a) and copolymer S1, PLA–10R5–PLA, Mn=4.6×10³ (b); (C) GPC curves of the prepared PLA–10R5–PLA block copolymers, S1, Mn=4.6×10³, S2, Mn=19.8×10³.
Abbreviations: PLA, polylactic acid; 10R5, reverse Pluronic®10R5; FTIR, Fourier transform infrared spectroscopy; GPC, gel permeation chromatography; Mn, number-average molecular weight; Sn(Oct)2, stannous octoate.
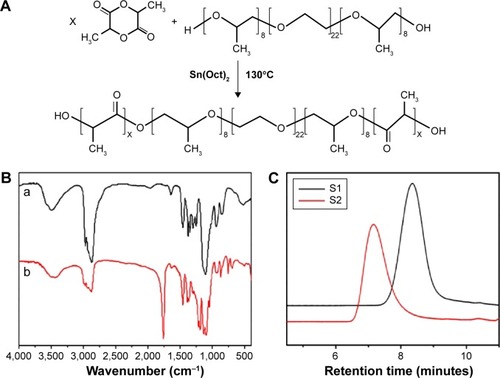
Table 2 The PLA–10R5–PLA copolymer nanoparticles prepared in this work
Figure 2 Characterization of PLA-10R5-PLA copolymer NPs.
Notes: (A) Morphology of normal saline (NS) (a), EGF-NP (b), Cur in NS (c), Cur-NP (d), and EGF-Cur-NP (e); (B) particle size distribution of EGF-Cur-NP; (C) TEM image of EGF-Cur-NP (magnification 50,000×); (D) FTIR spectrum of EGF, Cur, the black NP, and EGF-Cur-NP.
Abbreviations: EGF, epidermal growth factor; NP, nanoparticle; Cur, curcumin; TEM, transmission electron microscopy; FTIR, Fourier transform infrared spectroscopy.
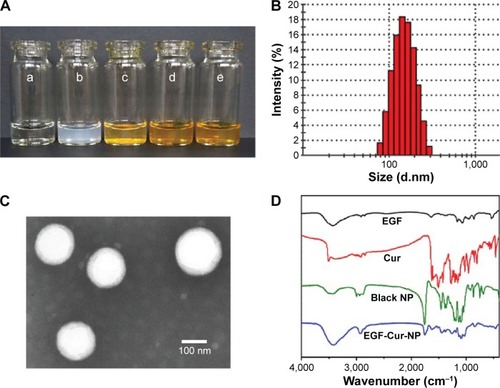
Figure 3 Characterization of EGF-Cur-NP/H.
Notes: (A) Photographs of the black hydrogel (a), EGF-Cur-NP/H (c) exhibiting a free-flowing sol at 25°C and a solid-like gel after being heated to 37°C (b, d); (B) SEM image of EGF-Cur-NP/H; (C) rheology analysis of EGF-Cur-NP/H as a function of temperature.
Abbreviations: EGF, epidermal growth factor; NP, nanoparticle; H, hydrogel; Cur, curcumin; SEM, scanning electron microscopy; G′, storage modulus; G″, loss modulus; η, viscosity.
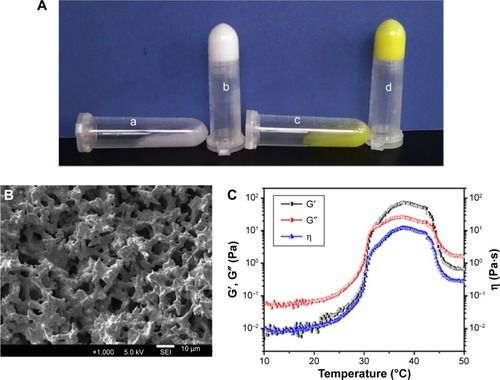
Figure 4 In vitro cytotoxicity and drug release study.
Notes: Cell viability test of HEK293 cells (A) and 3T3 cells (B) after incubation with EGF-Cur-NP/H extracts of different concentrations (100%, 50%, 25%, 0% as the negative control, and 0.1% phenol as the positive control). Data were presented as mean ± SD, n=6. In vitro drug release profile of EGF from free EGF, EGF-Cur-NP, and EGF-Cur-NP/H (C) and Cur from free Cur, EGF-Cur-NP, and EGF-Cur-NP/H (D) in PBS solution at pH 7.4. Data were presented as mean ± SD, n=3.
Abbreviations: EGF, epidermal growth factor; OD, optical density; NP, nanoparticle; H, hydrogel; Cur, curcumin; SD, standard deviation; PBS, phosphate-buffered saline.
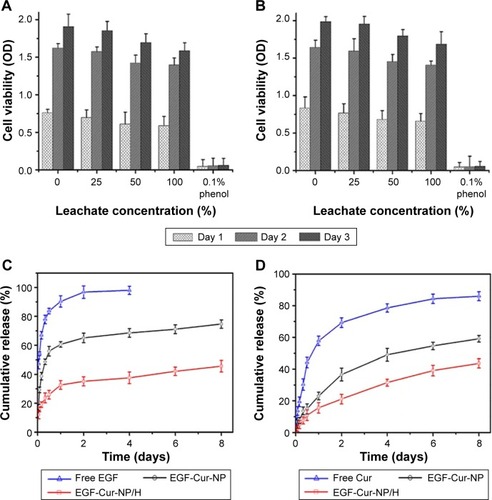
Figure 5 Macroscopic observations of wound closure for NS, NP/H, EGF-NP/H, Cur-NP/H, and EGF-Cur-NP/H treated groups at day 0, 3, 7, 10, and 14 post-wounding.
Abbreviations: EGF, epidermal growth factor; NS, normal saline; NP, nanoparticle; H, hydrogel; Cur, curcumin.
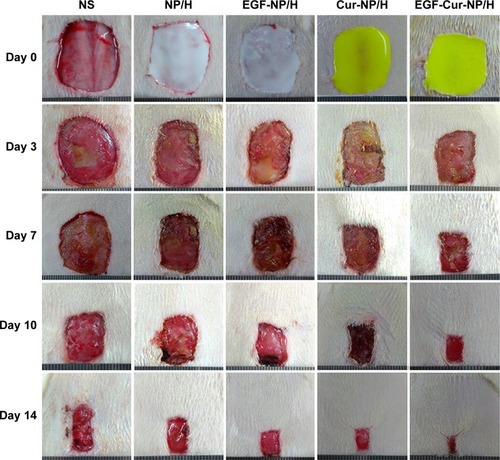
Figure 6 In vivo wound healing effects of EGF-Cur-NP/H.
Notes: (A) Wound closure rate of all the groups at day 3, 7, 10, and 14; (B) the granulation tissue formation score of all the groups at day 7 and 14; (C) the wound maturity score of all the groups at day 14; (D) semi-quantitative analysis of collagen deposition at day 7 and 14. Data were presented as mean ± SD, n=6, *P<0.05 was considered significant.
Abbreviations: EGF, epidermal growth factor; NP, nanoparticle; H, hydrogel; Cur, curcumin; SD, standard deviation; NS, normal saline.
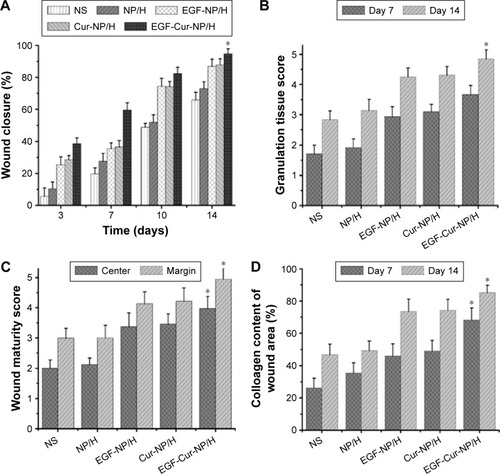
Figure 7 H&E and MT staining of the wounds.
Notes: Representative images of H&E (A), and MT (B) staining of wounds treated with NS, NP/H, EGF-NP/H, Cur-NP/H, and EGF-Cur-NP/H at day 7 and 14 post-wounding. Scale bar =50 μm, magnification 20×.
Abbreviations: EGF, epidermal growth factor; H&E, hematoxylin and eosin; MT, Masson’s trichrome; NP, nanoparticle; H, hydrogel; Cur, curcumin; NS, normal saline.
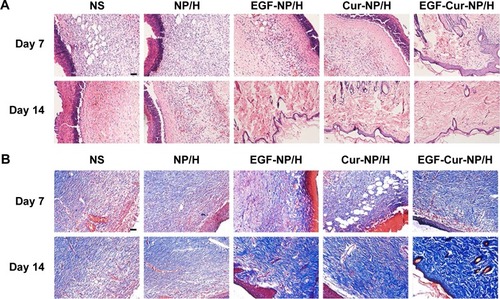
Figure 8 TGF-β1 staining of the wounds.
Notes: Fluorescent microscopy of TGF-β1 staining wounds treated with NS (A), NP/H (B), EGF-NP/H (C), Cur-NP/H (D), and EGF-Cur-NP/H (E) at day 7 post-wounding. Nuclei were stained blue with DAPI, and TGF-β1 was stained green. (F) Semi-quantitative estimation of TGF-β1 expression in each group. Data were presented as mean ± SD, n=10, *P<0.05 was considered significant. Scale bar =50 μm, magnification 20×.
Abbreviations: NS, normal saline; NP, nanoparticle; H, hydrogel; EGF, epidermal growth factor; Cur, curcumin; DAPI, 4′,6-diamidino-2-phenylindole; SD, standard deviation; TGF-β1, transforming growth factor beta-1.
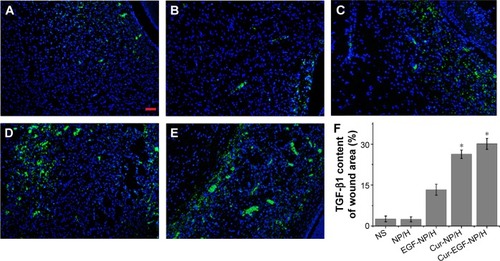
Figure 9 CD31 staining of the wounds.
Notes: Fluorescent microscopy of CD31 staining wounds treated with NS (A), NP/H (B), EGF-NP/H (C), Cur-NP/H (D), and EGF-Cur-NP/H (E) at day 14 post-wounding. Nuclei were stained blue with DAPI, and the newly formed vessels were stained green. (F) Vascular density of each group. Data were presented as mean ± SD, n=10, *P<0.05 was considered significant. Scale bar =50 μm, magnification 20×.
Abbreviations: NS, normal saline; NP, nanoparticle; H, hydrogel; EGF, epidermal growth factor; Cur, curcumin; DAPI, 4′,6-diamidino-2-phenylindole; SD, standard deviation.
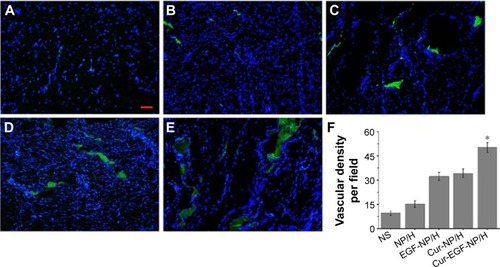
Figure 10 Schematic representation of mechanisms of action of Cur and EGF in wound healing processes.
Abbreviations: NP, nanoparticle; H, hydrogel; Cur, curcumin; EGF, epidermal growth factor; ROS, reactive oxygen species; TGF-β1, transforming growth factor beta-1.
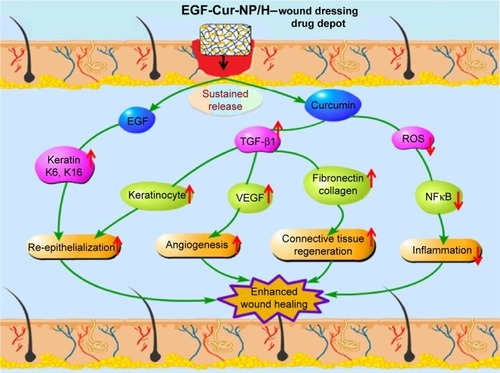
Figure S1 1H NMR test.
Notes: The 1H NMR spectrum of 10R5 (A); PLA–10R5–PLA, Mn=4.6×10³ (B); and PLA–10R5–PLA, Mn=19.8×10³ (C).
Abbreviations: 1H NMR, 1H nuclear magnetic resonance spectroscopy; PLA, polylactic acid; 10R5, reverse Pluronic®10R5; Mn, number-average molecular weight.
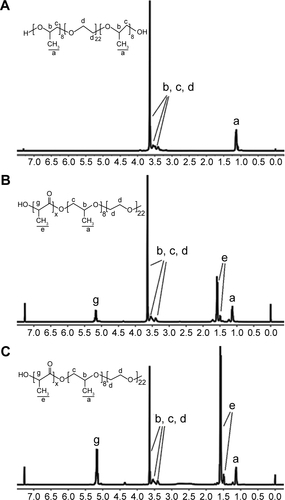
Figure S2 Analysis of EGF purity by HPLC.
Abbreviations: HPLC, high performance liquid chromatography; EGF, epidermal growth factor.
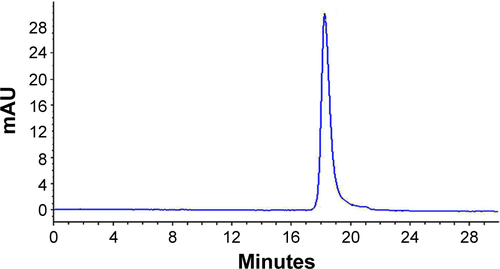
Figure S3 Particle size distribution of the nanoparticles.
Notes: Particle size distribution of the black NP (A); EGF-NP (B); and Cur-NP (C).
Abbreviations: NP, nanoparticle; Cur, curcumin; EGF, epidermal growth factor.
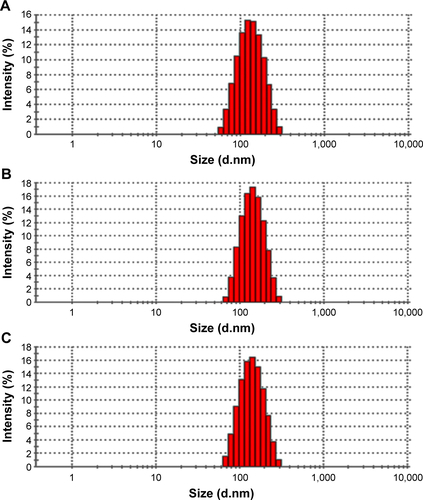
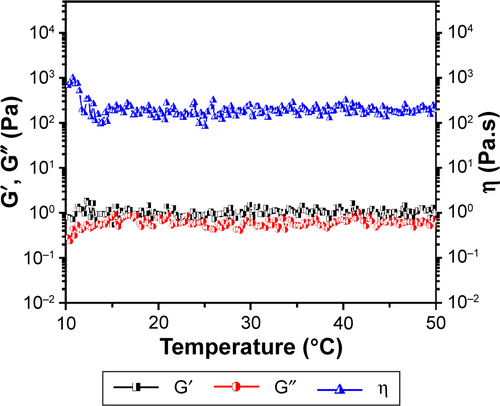
Figure S4 Rheology analysis of reverse Pluronic®10R5 aqueous solution (30 wt%) as a function of temperature.
Abbreviations: G′, storage modulus; G″, loss modulus; η, viscosity.