Figures & data
Figure 1 TEM images and FT-IR spectra of composite iron oxide nanoparticles.
Notes: (a, b) TEM of citrate and dextran-coated IONP; (c, d) FT-IR spectrum of citrate and dextran-coated IONP.
Abbreviations: IONP, iron oxide nanoparticles; TEM, transmission electron microscope; FT-IR, Fourier transformed infrared spectroscopy.
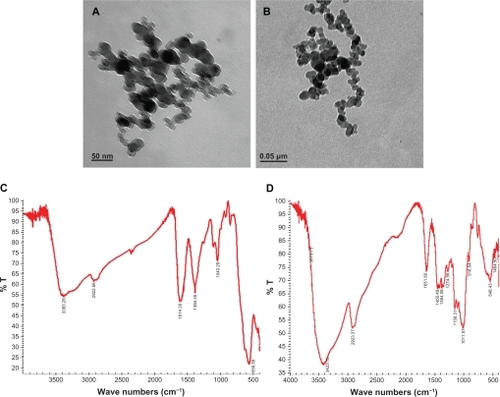
Figure 2 (a) Cell viability of citrate-IONP on HUVECs after 1, 6 and 24 hours. (b) Cell viability of dextran-IONP on HUVECs after 1, 6 and 24 hours.
Notes: Percentage of viability of HUVECs was expressed relative to control cells (n = 3).
Abbreviations: HUVECs, human umbilical vein endothelial cells; IONP, iron oxide nanoparticles.
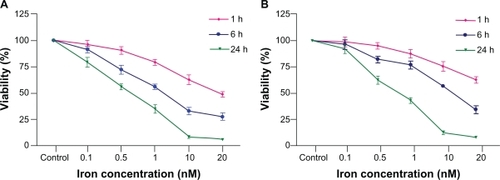
Figure 3 Prussian blue stained and nucleus fast red counterstained HUVECs incubated without or with different IONP samples. (×200 magnification).
Notes: (a) Control: without any particles; (b, d) with citrate-IONP; (c, e) with dextran-IONP; (b, c) cells were incubated with IONPs at iron concentration of 0.1 nM; (d, e) cells were incubated IONPs at iron concentration of 1 nM.
Abbreviations: HUVECs, human umbilical vein endothelial cells; IONP, iron oxide nanoparticles.
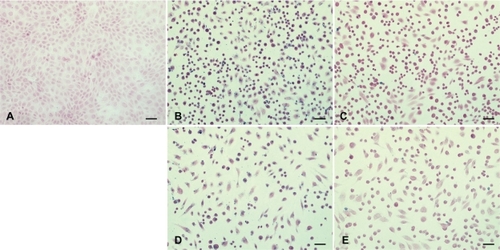
Figure 4 TEM of HUVECs incubated with IONPs for one hour, (×8000 magnification).
Notes: (a) control cell (without incubation of any particles); (b, d, f) with citrate-IONP; (c, e, g) with dextran-IONP; (b, c) cells were incubated with IONPs at iron concentration of 0.1 nM; (d–g) cells were incubated with IONPs at iron concentration of 1 nM; (b, c) Particles were taken up into lysosomes; (d, e) Many vacuoles could be found in cytoplasm; (f, g) Abnormal dense filament matter appeared adjacent to vacuoles (yellow arrow: IONPs, black arrow: vacuoles, rectangular: filaments, L: lysosome).
Abbreviations: IONP, iron oxide nanoparticles; TEM, transmission electron microscope; HUVECs, human umbilical vein endothelial cells.
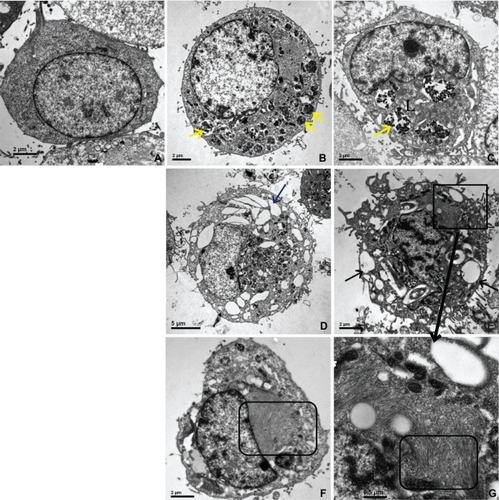
Figure 5 HUVECs were stained for F-actin (red), vinculin (green), nucleus (blue) and β-tubulin (green) with or without IONPs incubation, (×13000 magnification).
Notes: (a–d) Untreated control cell; (e–h) One hour incubation with dextran-IONP at 0.1 mM; (i–l) One hour incubation with citrate-IONP at 0.1 mM.
Abbreviations: HUVECs, human umbilical vein endothelial cells; IONP, iron oxide nanoparticles.
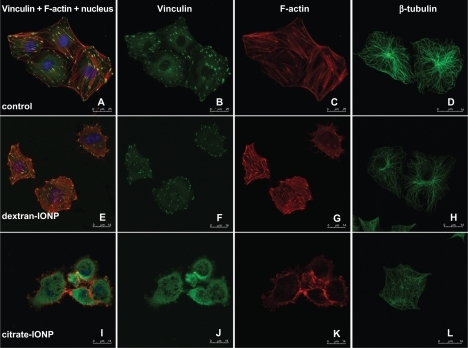
Figure 6 Vasculogenesis in vitro with HUVEC in different culture conditions (stained by calcein AM, ×100 magnification).
Notes: (a) Cells were seeded on 96-well plate without Matrigel; (b) HUVECs which grew on Matrigel developed a geometrical network about 6 hours after cell adhesion; (c) dextran-IONP treated cells provided a partially poorly developed branch elongated shape compared with the untreated cells; (d) citrate-IONP treated cells demonstrated no tendency for vascular network formation.
Abbreviations: HUVECs, human umbilical vein endothelial cells; IONP, iron oxide nanoparticles.
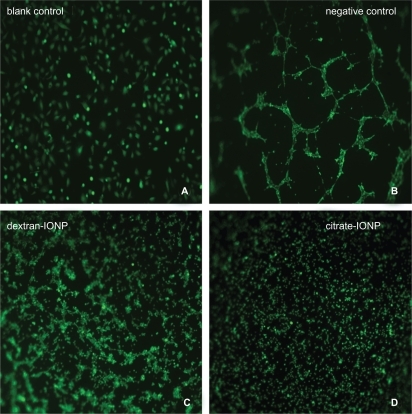
Figure 7 Migration assay of HUVECs under incubation with IONPs for 1 hour.
Notes: (x̄± SD, n = 3) *P < 0.05. HUVECs were incubated with IONPs at different iron concentrations, and cell migration greatly decreased compared with control cells. Citrate-IONP reduced migration more than dextran-IONP at an iron concentration of 0.1 mM.
Abbreviations: HUVECs, human umbilical vein endothelial cells; IONP, iron oxide nanoparticles.
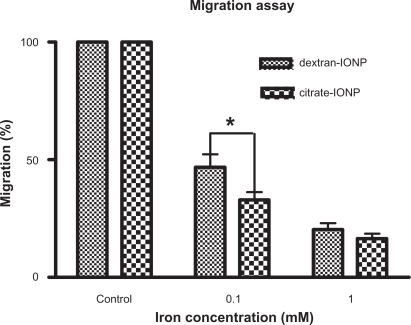
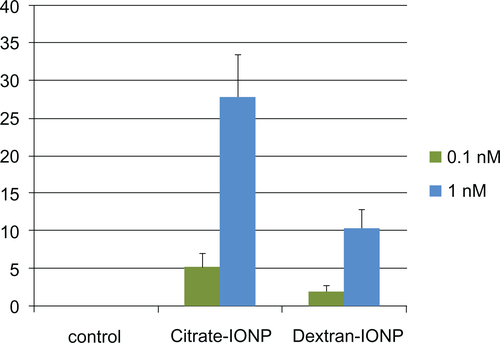
Figure 8 Invasion assay of HUVECs under incubation with IONPs for 1 hour.
Notes: (x̄ ± SD, n = 3) *P < 0.05, **P < 0.01. HUVEC invasion through the matrix was inhibited compared to control cells. Citrate-IONP had a stronger inhibition capacity than dextran-IONP (P < 0.05, 1 mM; P < 0.01, 0.1 mM).
Abbreviations: HUVECs, human umbilical vein endothelial cells; IONP, iron oxide nanoparticles.
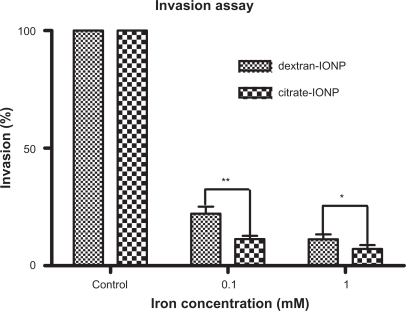
Figure S1 FT-IR spectra of citric acid.
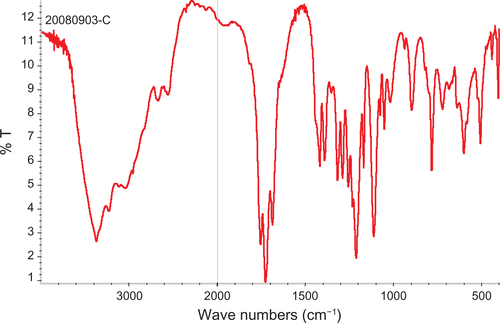
Figure S2 FT-IR spectra of dextran.
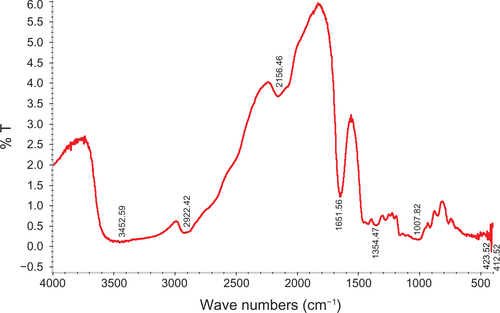
Figure S3 FT-IR spectra of bare iron oxide particles.
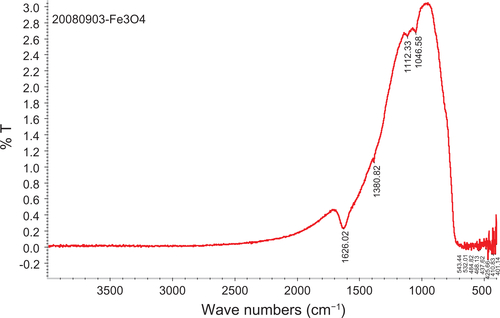
Figure S4 Optical microscopy of HUVECs incubated without or with different IONPs for 24 h. (a) control cell without any particles; (b–d) cells were incubated with citrate-IONP at iron concentration of 0.1, 1 and 10 nM; (e–g) cells were incubated with dextran-IONP at iron concentration of 0.1, 1 and 10 nM.
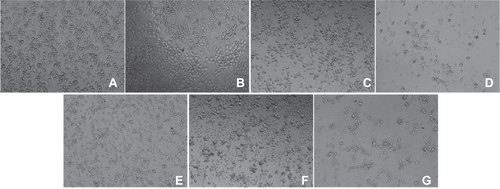
Figure S5 Annexin V kit fluorescent staining of HUVECs incubated without or with different IONPs for 6 h. (a) control cells without any particles; (b, d) with citrate-IONP; (d, e) with dextran-IONP; (b, c) cells were incubated with IONPs at iron concentrations of 0.1 nM. cells were incubated with IONPs at iron concentration of 1 nM. Arrows denote possible apoptotic cells. Bar 100 μm.
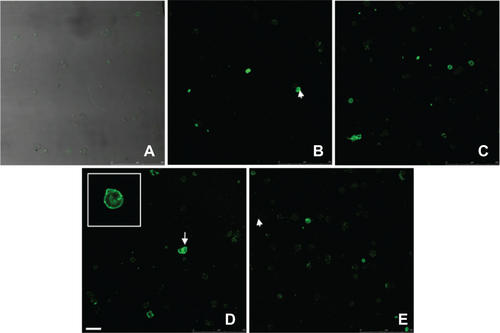
Figure S6 The percentage of apoptotic cells were counted and expressed graphically after 6 h exposure to IONPs.