Figures & data
Table 1 Liposome components
Figure 1 Luciferase reporter gene expression in vivo. After three consecutive daily tail vein injections of DOTAP/chol/DNA lipoplex (A-0*) in nude mice organs were sampled on the fourth day and assayed for luciferase activity, n = 4. Assay background was at 10 pg luc/g protein (indicated with dotted line).
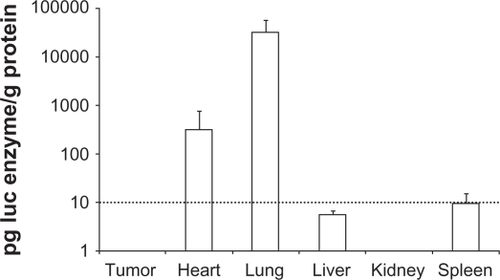
Figure 2 Agarose gel electrophoresis/ethidium bromide staining of DNA/lipoplexes with different content of PEG-lipid compared to the migration of free plasmid DNA (free DNA) and a DNA size marker.
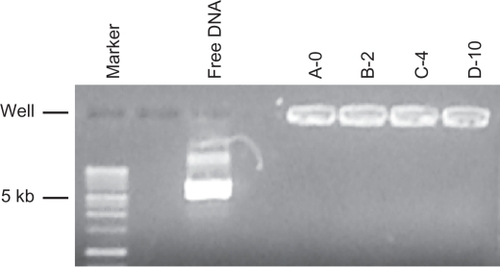
Figure 3 Physical characterization of lipoparticles using a Zetasizer. Each of the four liposome formulations was analyzed before (white columns) and after (grey columns) mixing with plasmid DNA. A) The hydrodynamic size. B) The polydispersity index. C) The zeta potential of the particles. The estimate and the standard error are given for each measurement. Three independent experiments yielded equivalent results.
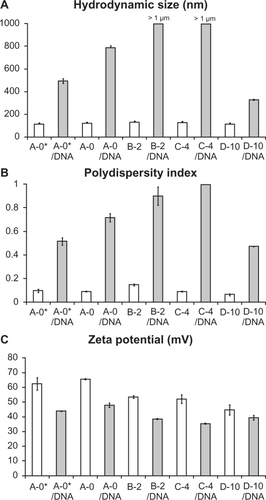
Figure 4 Reporter gene expression by transfection of NCI-H69 (SCLC) and H1299 (NSCLC) cells in vitro. A) EGFP fluorescence in single cells was measured by FACS flow cytometry and expressed as the percentage of EGFP positive cells. *** indicates a significant difference from A-0 (P < 0.001). B) Luciferase activity was measured in cell lysates and expressed as picogram luciferase per milligram of protein. Data from four independent experiments with two different lipid preparations were collected and the average and standard error of the mean are given. *indicates a significant difference from A-0 (P < 0.05).
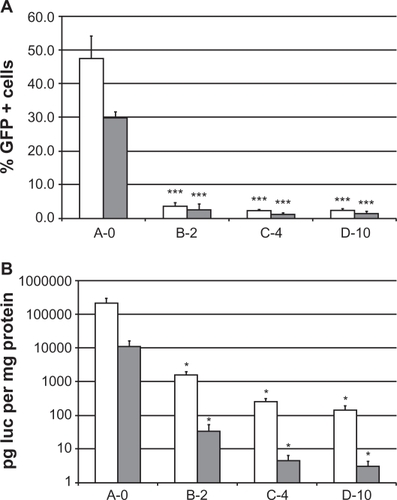
Figure 5 Cellular uptake of fluorescently labeled lipoplexes. A) Bright-field and fluorescence microscope pictures taken two days after H1299 cells were transfected with NBD-labeled A-0 (upper panel) and D-10 lipoplexes (lower panel). Scale bar marked in red indicates 15 μm. B) NBD fluorescence in cell lysates was measured at different time points after addition to cell cultures. Non-PEGylated A-0 lipoplex is rapidly taken up by cells to a saturating level within one hour and remain constant hereafter (fitted line [estimate ± standard error]: Fluorescence index = (1001 ± 102) + (2.8 ± 3.6) × time) Slope confidence interval includes 0. In contrast, PEGylated lipoplexes are gradually taken up over two days. Fitted lines: B-2: Fluorescence index = (626 ± 115) + (15 ± 4.3) x time; C-4: Fluorescence index = (487 ± 71) + (15 ± 2.9) × time; D-10: Fluorescence index = (678 ± 92) + (44 ± 3.7) × time. Slope confidence interval exclude 0. Data are normalized and averaged from triplicates of three independent experiments (average ± SD).
![Figure 5 Cellular uptake of fluorescently labeled lipoplexes. A) Bright-field and fluorescence microscope pictures taken two days after H1299 cells were transfected with NBD-labeled A-0 (upper panel) and D-10 lipoplexes (lower panel). Scale bar marked in red indicates 15 μm. B) NBD fluorescence in cell lysates was measured at different time points after addition to cell cultures. Non-PEGylated A-0 lipoplex is rapidly taken up by cells to a saturating level within one hour and remain constant hereafter (fitted line [estimate ± standard error]: Fluorescence index = (1001 ± 102) + (2.8 ± 3.6) × time) Slope confidence interval includes 0. In contrast, PEGylated lipoplexes are gradually taken up over two days. Fitted lines: B-2: Fluorescence index = (626 ± 115) + (15 ± 4.3) x time; C-4: Fluorescence index = (487 ± 71) + (15 ± 2.9) × time; D-10: Fluorescence index = (678 ± 92) + (44 ± 3.7) × time. Slope confidence interval exclude 0. Data are normalized and averaged from triplicates of three independent experiments (average ± SD).](/cms/asset/b7fb4259-bb43-40d5-819b-b17a6d878ed0/dijn_a_12184590_f0005_c.jpg)
Figure 6 Effects of endocytosis inhibitors on luciferase reporter activity measured in (A) NCI-H69 and (B) 1299 cells. Cells were incubated one hour prior to transfection and then exposed to inhibitors for the entire incubation (48 hours). Chloroquine (20 μM (NCI-H69), 30 μM (H1299)), chlorpromazine 10 μM (NCI-H69), 20 μM (H1299), filipin (4 μM), and cytochalasin B (25 μM). Data from 3–5 independent experiments were pooled and log2 transformed to obtain fold change in expression. Error bars indicate standard error of the mean, *means that 0 is not included in confidence interval (P < 0.05), no change: N.S.
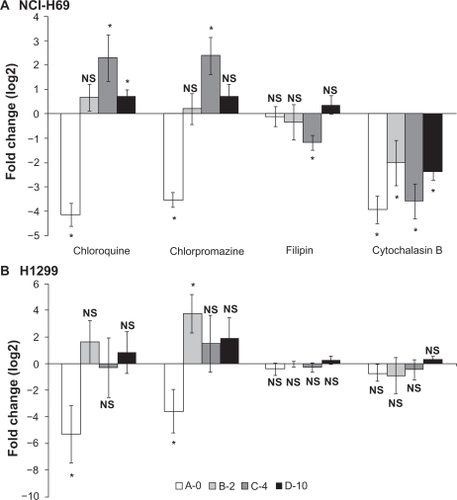
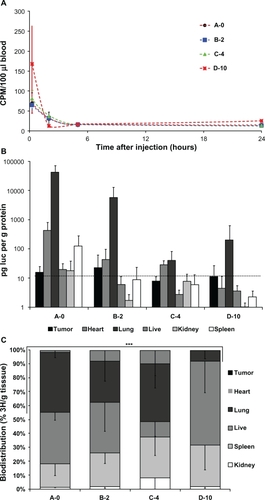
Figure 7 A) Blood availability of tritium-labeled lipoplexes with PEGylation. Following tail vein injection of lipoplexes blood samples were drawn by periobital plexus puncture (eye vein blood) after 15 minutes, 2 hours, 5 hours, and 24 hours, and the amount of radioactivity was quantified by scintillation counting. B) Biodistribution of luciferase activity. Mice injected with tritium-labeled DNA/lipoplex with different degrees of PEGylation were sacrificed after 24 hours and samples from organs were analyzed for luciferase activity. Background level in assay is 10 pg/g protein (indicated with dotted line). C) Biodistribution of radioactivity. Tritium counts were expressed as CPM per gram organ sample weight (CPM/g) and the relative distribution in tumor, heart, lung, liver, kidney, and spleen was calculated. Error bars indicate standard deviations. In each group, n = 3–5. A two sided t-test of accumulation in heart/lung samples between A-0 and D-10 results in P = 1.9E-05 (***).