Figures & data
Figure 1 Photographs and SEM images of the collagen scaffolds.
Notes: (A) Photographs of the collagen scaffold (i), 0.1 µg/mL GO scaffold (ii), and 1 µg/mL GO scaffold (iii). SEM images of collagen scaffold (B), 0.1 µg/mL GO scaffold (C), and 1 µg/mL GO scaffold (D and E). (D) The wrinkled structure of GO was observed on collagen fibers. (E) GO scaffold possessed an interconnected structure.
Abbreviations: GO, graphene oxide; SEM, scanning electron microscopy.
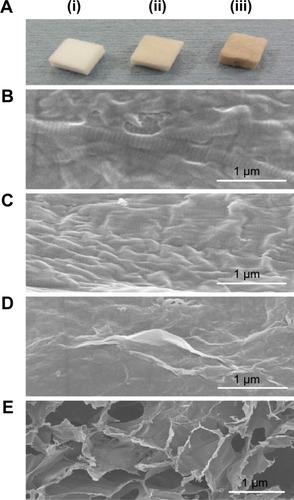
Table 1 Structural parameters of the scaffold (N=5, mean ± SD)
Figure 2 (A–D) In vitro assessment of each scaffold (N=6, mean ± SD).
Note: *P<0.05, vs control.
Abbreviations: Crtl, control; GO, graphene oxide; SD, standard deviation.
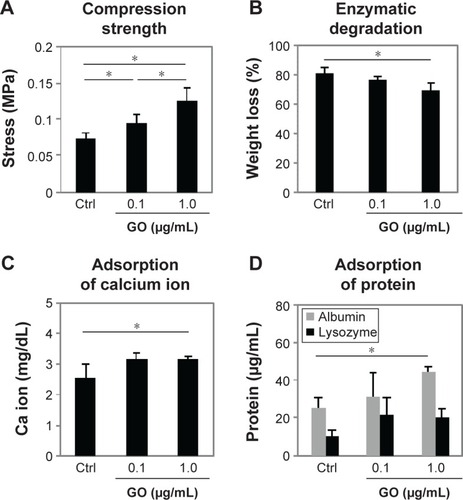
Figure 3 Cytocompatibility of GO scaffold.
Notes: Microscopic images of control (A) and 1 µg/mL GO scaffold (B) with MC3T3-E1 cells after 7 days incubation. Cultured cells (arrows) were detected frequently in the GO scaffold. (C) SEM image of 1 µg/mL GO scaffold with MC3T3-E1 cells after 1 day incubation. Cell spreading with fine processes elongation (white arrows) was observed. (D) WST-8 assay (N=6, mean ± SD). *P<0.05, vs control. Original magnification (A, B) 25×, (C) 10000×.
Abbreviations: Crtl, control; GO, graphene oxide; SEM, scanning electron microscopy; SD, standard deviation.
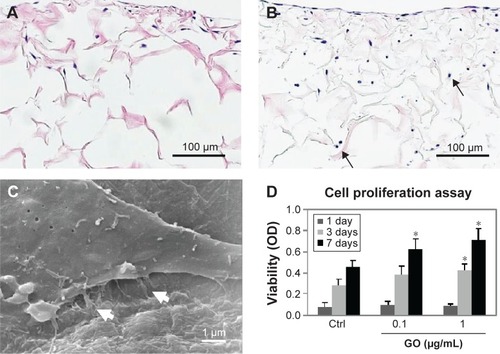
Figure 4 Rat subcutaneous tissue response to GO scaffold.
Notes: Histological findings for control (A–C), 0.1 µg/mL GO scaffold (D–F), and 1 µg/mL GO scaffold (G–L) in rat subcutaneous tissue at 10 days. Rectangles (b, c, e, f, h, and i) in (A), (D), and (G) are enlarged in (B), (C), (E), (F), (H), and (I), respectively. Cell and tissue ingrowth behavior was remarkable in 1 µg/mL GO scaffold. H&E staining. (J–L) In vivo assessment of each scaffold for number of giant cells, tissue ingrowth area, and DNA content (N=6, mean ± SD). *P<0.05. Original magnification (A, D, G) 3×, (B, C, E, F, H, I) 50×.
Abbreviations: Crtl, control; GO, graphene oxide; H&E, hematoxylin–eosin; SD, standard deviation.
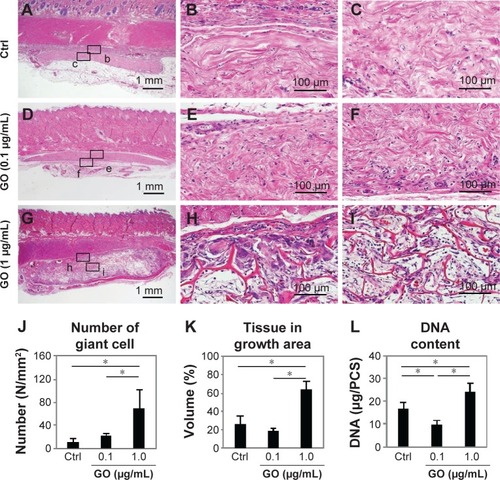
Figure 5 Immunohistochemical observation of GO scaffold.
Notes: Immunofluorescence micrographs of macrophages, fibroblasts, and blood vessel cryostat sections stained (in red) with mouse anti-CD68 (ED-1) (A, E, I, M), mouse anti-CD163 (ED-2) (B, F, J, N), mouse anti-P4HB (C, G, K, O), and mouse ASMA (D, H, L, P) for 1 µg/mL GO scaffold (A–D) and control (E–H) implanted in rat subcutaneous tissue at 10 days and 1 µg/mL GO scaffold (I–L) and control (M–P) at 35 days. Infiltration of ED2-positive cells and ASMA-positive arterioles was more remarkable in the GO scaffold than in the collagen scaffold.
Abbreviations: Crtl, control; GO, graphene oxide; P4HB, prolyl-4-hydroxylase beta; ASMA, anti-α-smooth muscle actin.
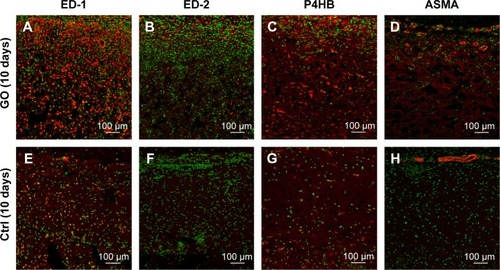
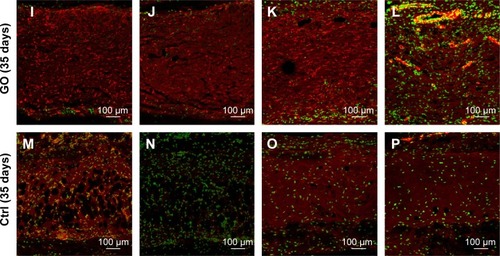
Figure 6 Peroxidase staining of GO scaffold.
Notes: Peroxidase-stained activity for granulocytes in implanted 1 µg/mL GO scaffold (A) and control (B) in rat subcutaneous tissue at 10 days and 1 µg/mL GO scaffold (C) and control (D) at 35 days. Peroxidase-positive granulocytes (arrows) were detected slightly around the GO scaffold. Double arrows indicate the implanted scaffold. Original magnification (A, B, C, D) 25×.
Abbreviation: GO, graphene oxide.
Figure 7 Implantation of GO scaffold to extraction socket.
Notes: (A) Photograph of implanted scaffold. (B) Macroscopic view at 2 weeks postsurgery. (C) Radiographic images immediately after operations. (D) Radiographic image at 2 weeks postsurgery. The socket applied with GO scaffold showed increased radiopacity.
Abbreviation: GO, graphene oxide.
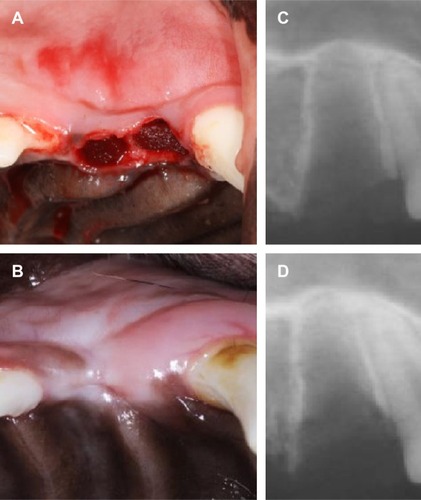
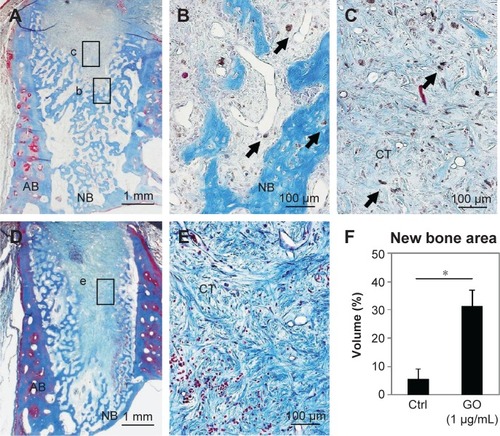
Figure 8 Histological findings in extraction socket at 2 weeks.
Notes: (A) Specimen receiving 1 µg/mL GO scaffold. (B and C) Higher magnification of the framed area (b, c) in (A). Residual GO (arrows) were observed in newly formed bone and connective tissue. (D) Specimen receiving control material. (E) Higher magnification of the framed area (e) in (D). MT staining. (F) Histomorphometric measurements of newly formed area. *P<0.05. Original magnification (A, D) 3×, (B, C, E) 50×.
Abbreviations: AB, alveolar bone; NB, new bone; CT, connective tissue; GO, graphene oxide; MT, Masson’s trichrome; Crtl, control.