Figures & data
Figure 1 Photograph of rSeNPs (left) and gray selenium microcrystals (right).
Notes: Left: 1,000 μg/mL rSeNPs. Right: 1,000 μg/mL rSeNPs that have begun an allotrope shift after 10 minutes of exposure to temperatures >31°C, specifically 50°C.
Abbreviation: rSeNPs, red-allotrope selenium nanoparticles.
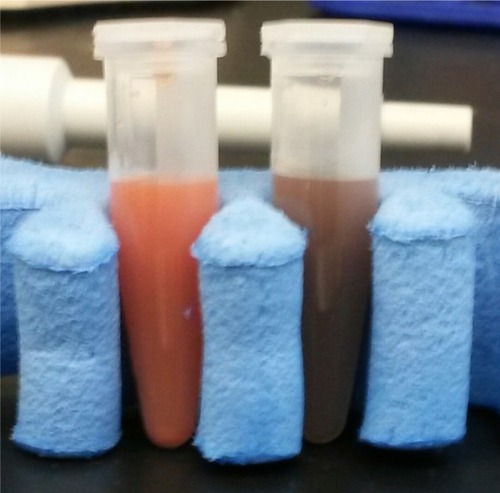
Figure 2 SEM image and size distribution of rSeNPs.
Notes: (A) SEM image of rSeNPs. (B) Size distribution of rSeNPs as determined by ImageJ (National Institutes of Health, Bethesda, MD, USA).
Abbreviations: SEM, scanning electron microscopy; rSeNPs, red-allotrope selenium nanoparticles.
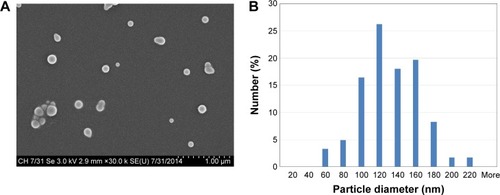
Figure 3 Zeta potential analysis of rSeNPs.
Abbreviations: rSeNPs, red-allotrope selenium nanoparticles; Rel, relative; Ref, reference; Std, standard; Temp, temperature.
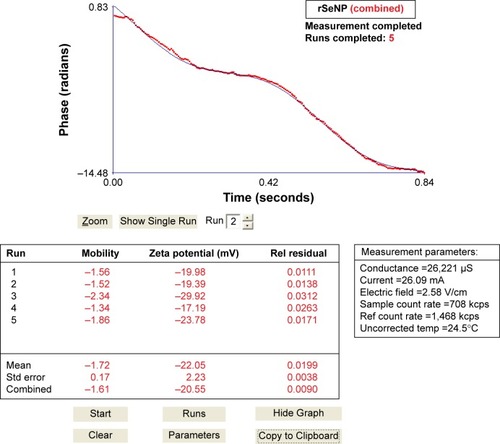
Figure 4 XPS analysis of rSeNPs.
Notes: (A) Overall XPS results of rSeNPs. (B) XPS selenium 3d bond spike present in the rSeNP sample. (C) XPS quantitative data for rSeNPs. Na 1s represents the 1s orbital of sodium, O 1s is the 1s orbital of oxygen, C 1s is the 1s orbital of carbon, and Se 3d is the 3d orbital of selenium.
Abbreviations: XPS, X-ray photoelectron spectrometry; rSeNPs, red-allotrope selenium nanoparticles; CPS, counts per second; BE, binding energy; FWHM, full width at half maximum.
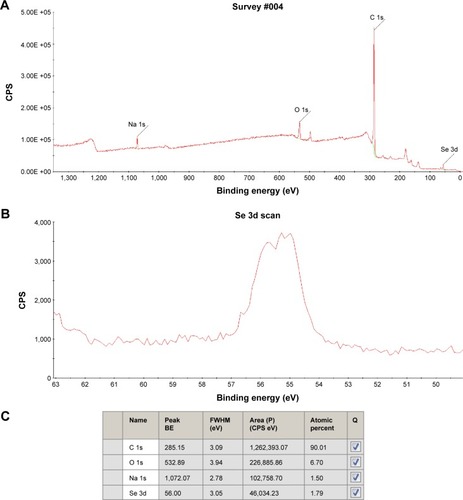
Figure 5 In vitro anticancer activity and cytotoxic effect of rSeNPs.
Notes: (A) In vitro anticancer activity of rSeNPs against the HNSCC cell line SCC-9, relative to untreated cells. (B) In vitro cytotoxic effect of rSeNPs on the HDF cell line CC-2509, relative to untreated cells. (A and B) Data are presented as mean ± StErM (N=3). *P<0.001 compared to the next smallest dosage at the same incubation time, **P<0.001 compared to the next shortest incubation time at the same dosage, and ***P<0.001 compared to controls (0 μg/mL) at the same incubation time.
Abbreviations: rSeNPs, red-allotrope selenium nanoparticles; HNSCC, head and neck squamous cell carcinoma; HDF, human dermal fibroblast; StErM, standard error of the mean.
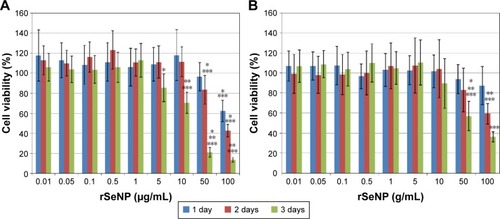
Figure 6 In vitro cytotoxic effect of rSeNPs on cell count.
Notes: (A) HNSCC cell line SCC-9. (B) HDF cell line CC-2509. (A and B) Data are presented as mean ± StErM (N=3). (A) *P<0.001 compared to the next smallest dosage at the same incubation time. (B) *P<0.001 compared to controls (0 μg/mL) at the same incubation time. (A and B) **P<0.001 compared to the next shortest incubation time at the same dosage and ***P<0.001 compared to controls (0 μg/mL) at the same incubation time.
Abbreviations: rSeNPs, red-allotrope selenium nanoparticles; HNSCC, head and neck squamous cell carcinoma; HDF, human dermal fibroblast; StErM, standard error of the mean.
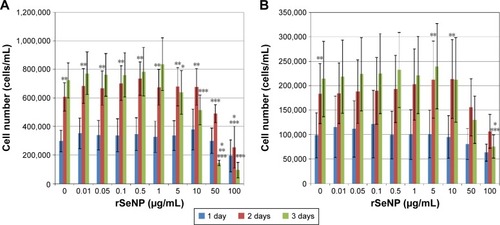
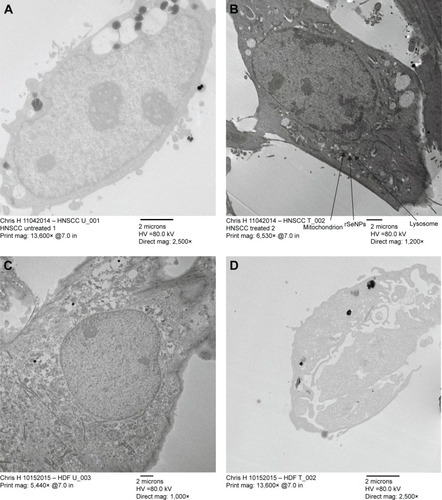
Figure 7 Magnified TEM of organelles and rSeNPs in HNSCC and HDF cell lines.
Notes: Magnified TEM of organelles in (A) HNSCC cell line SCC-9 and (C) HDF cell line CC-2509, untreated and stained. Magnified TEM of organelles and rSeNPs in (B) HNSCC cell line SCC-9 and (D) HDF cell line CC-2509, treated and unstained. Bright white dots may be selenium nanoparticles.
Abbreviations: TEM, transmission electron microscopy; rSeNPs, red-allotrope selenium nanoparticles; HNSCC, head and neck squamous cell carcinoma; HDF, human dermal fibroblast; HV, high vacuum.
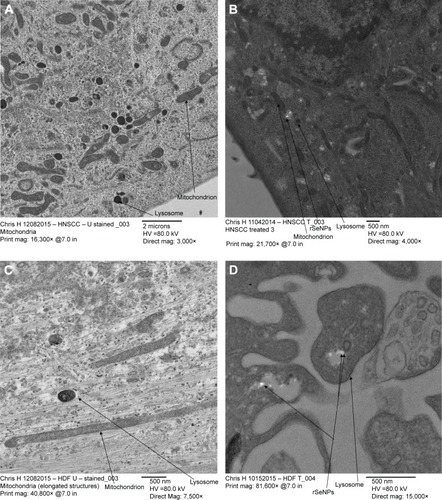
Figure 8 TEM of HNSCC and HDF cell lines.
Notes: TEM of HNSCC cell line SCC-9: (A) untreated and unstained and (B) treated and unstained. (B) Bright white dots may be selenium nanoparticles. TEM of HDF cell line CC-2509: (C) untreated and unstained and (D) treated and unstained. The large black dots are impurities on the grid, likely due to excessive handling.
Abbreviations: TEM, transmission electron microscopy; HNSCC, head and neck squamous cell carcinoma; HDF, human dermal fibroblast; HV, high vacuum.