Figures & data
Table 1 Solubility of GM in various mediums (mean ± SD, n=3)
Figure 1 Pseudoternary phase diagrams of Capryol 90, Cremophor RH40/Transcutol (A–E) or Cremophor EL/Transcutol (F, G) and distilled water.
Note: The oil/water microemulsion should be prepared in the ratios given in the shaded area.
Abbreviation: Sm, surfactant mixture.

Table 2 Observed responses in the Box-Behnken design for microemulsions
Table 3 Variables in the Box-Behnken design
Figure 2 Contour plot and corresponding response surface plot showing effect of oil, Sm, and water on the concentration of GM in ME.
Note: The effects of oil, Sm and water on the concentration of GM in ME showed in (A–C) were similar to those in (D–F).
Abbreviations: Sm, surfactant mixture; GM, glimepiride; ME, microemulsions.
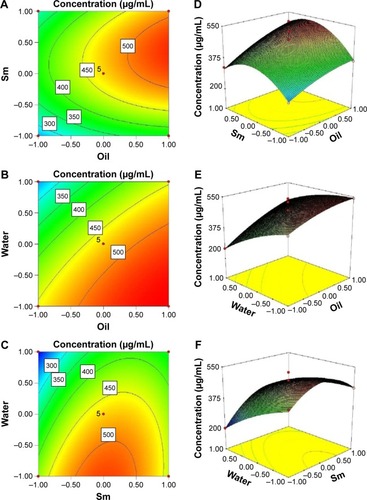
Table 4 Size, PDI and zeta potential of ME and GMME (mean ± SD, n=3)
Figure 3 The TEM images and the particle size distribution of ME (A) and GMME (B).
Abbreviations: TEM, transmission electron microscopy; ME, microemulsion; GMME, glimepiride microemulsion.
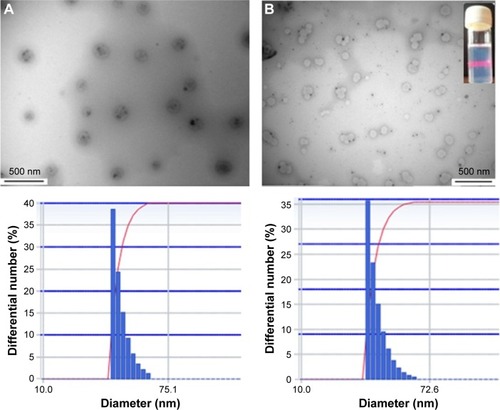
Figure 4 Release profile of glimepiride from microemulsions determined by the dialysis method in a pH 7.4 saline solution at 37°C (mean ± SD, n=3).
Abbreviations: SD, standard deviation; h, hours.
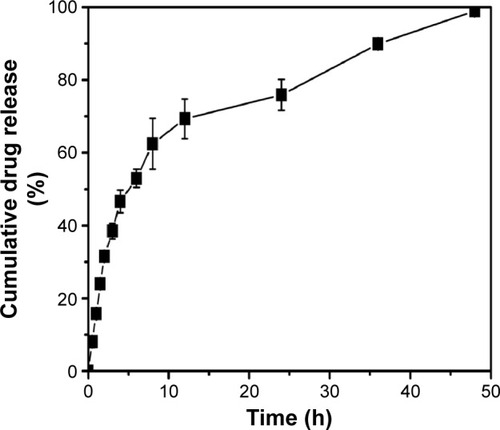
Figure 5 BGL of diabetic mice following IP (A) and IG (B) administration of different doses of GMME (mean ± SD, n=6).
Abbreviations: BGL, blood glucose level; GMME, glimepiride microemulsion; SD, standard deviation; h, hours.
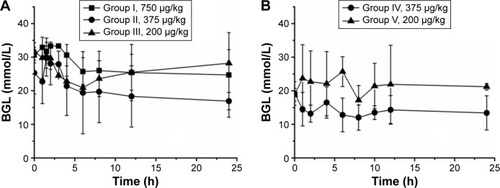
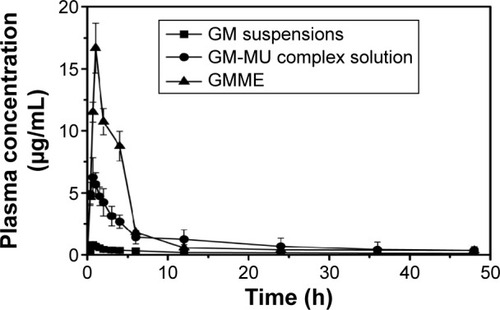
Table 5 PK parameters after IG administration of the GM suspensions, GM-MU complex solution and GMME at a dose of 5 mg/kg (n=6)
Figure 6 Plasma concentration–time curves after IG administration of the GM suspensions (-▪-), GM-MU complex solution (-•-) and GMME (-▴-) at a dose of 5 mg/kg in rats (n=6).
Abbreviations: GM, glimepiride; GM-MU, glimepiride-meglumine; GMME, glimepiride microemulsion; h, hours.