Figures & data
Figure 1 Characterization of Fe3O4 NPs.
Notes: TEM images of Fe3O4 NPs with the diameter of 6 nm (A), 9 nm (B), and 14 nm (C). (D) The size distribution images of Fe3O4 NPs; the inserted image is the image of Fe3O4 NPs aqueous solution. (E) The zeta potential image of Fe3O4 NPs.
Abbreviations: NPs, nanoparticles; TEM, transmission electron microscope.
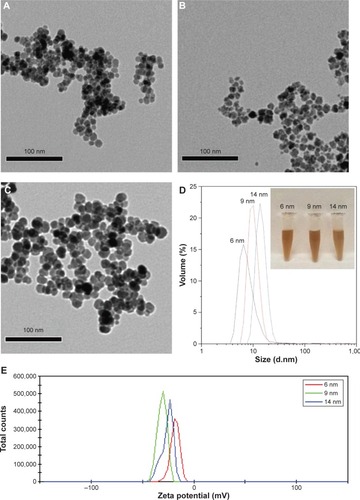
Figure 2 Cellular uptake of Fe3O4 NPs with different diameter sizes in human hepatoma SK-Hep-1 cells (A and B) and Hep3B cells (C and D) after exposure for 24 hours. Fe3O4 NPs-treated cells were determined by flow cytometry.
Notes: Cells incubated in medium only were used as control. Results correspond to mean ± SE of three independent experiments with triplicates in each case. ***P<0.001 compared to the control without Fe3O4 NPs treatment; ##P<0.01, ###P<0.001 compared to the corresponding Fe3O4 NPs treatment at 200 µg/mL; &&P<0.01, &&&P<0.001 between the indicated groups.
Abbreviations: fcs, flow cytometers; NPs, nanoparticles; SE, standard error; SSC, side scatter.
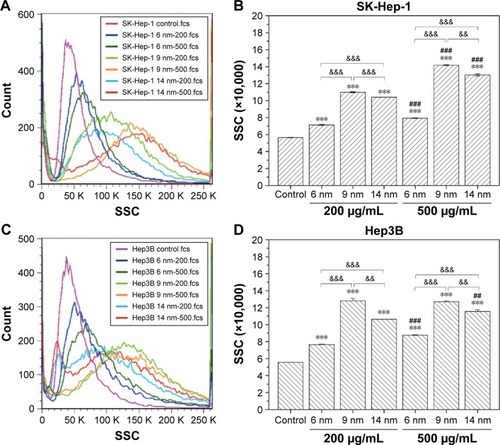
Figure 3 Internalization and localization of Fe3O4 NPs with different diameters in human hepatoma SK-Hep-1 cells after exposure for 24 hours.
Notes: Cells treated with Fe3O4 NPs were determined by TEM. Fe3O4 NPs are enclosed in vesicles.
Abbreviations: NPs, nanoparticles; TEM, transmission electron microscope.
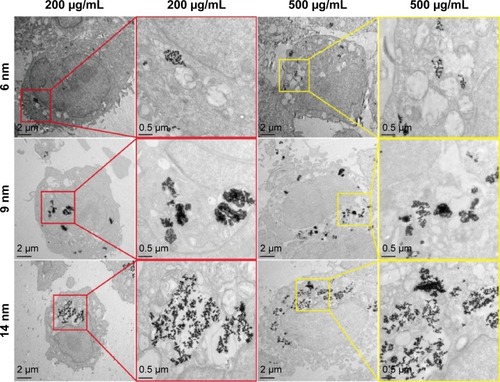
Figure 4 Effect of Fe3O4 NPs on mitochondrial function of human hepatoma SK-Hep-1 cells (A) and Hep3B cells (B).
Notes: Mitochondrial function of cells treated with various concentrations of Fe3O4 NPs with different diameters for 24 hours was measured by the CCK-8 assay. Data are presented as mean ± SE of three independent experiments with six replicates in each case. *P<0.05, **P<0.01, ***P<0.001 compared to the control without Fe3O4 NPs treatment.
Abbreviations: CCK-8, Cell Counting Kit-8; NPs, nanoparticles; SE, standard error.
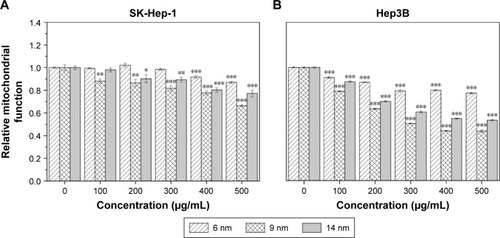
Figure 5 Influence of Fe3O4 NPs on the induction of ROS in human hepatoma SK-Hep-1 cells (A and B) and Hep3B cells (C and D).
Notes: Fe3O4 NPs-treated cells were determined by flow cytometry. Cells incubated in medium only were used as control. Results correspond to mean ± SE of three independent experiments. *P<0.05, **P<0.01, ***P<0.001 compared to the control without Fe3O4 NPs treatment; ##P<0.01, ###P<0.001 compared to the corresponding Fe3O4 NPs treatment at 200 µg/mL; &&P<0.01, &&&P<0.001 between the indicated groups.
Abbreviations: fcs, flow cytometers; NPs, nanoparticles; ROS, reactive oxygen species; SE, standard error.
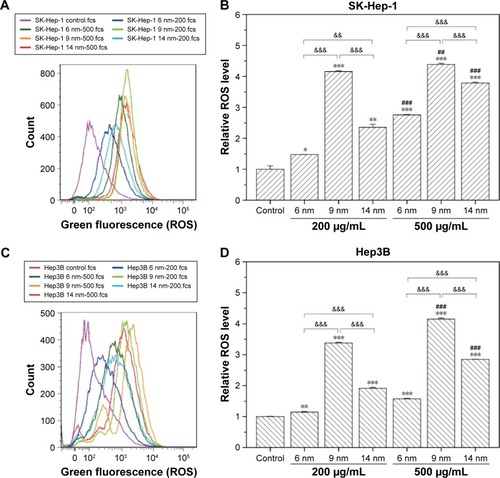
Figure 6 Induction of apoptosis and necrosis in Fe3O4 NPs-treated human hepatoma SK-Hep-1 cells (A) and Hep3B cells (B).
Notes: Cells exposed to Fe3O4 NPs with different diameters for 24 hours were determined by flow cytometry. Cells incubated in medium only were used as control. Results correspond to mean ± SE of three independent experiments.
Abbreviations: NPs, nanoparticles; SE, standard error; FITC, fluorescein isothiocyanate; PE, phycoerythrin; PI, propidium iodide.
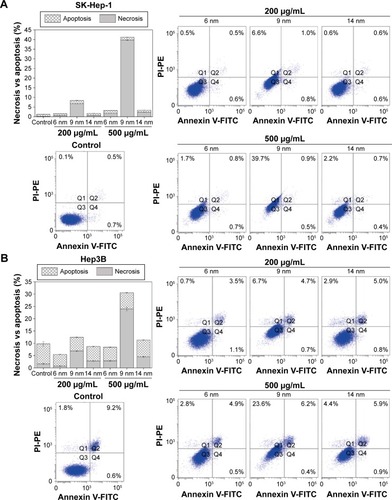
Figure 7 Fe3O4 NPs regulate the activities of Akt and MAPK in human hepatoma cells.
Notes: The expressions of Akt, Erk, and p38 were measured using Western blot in Hep3B cells exposed to Fe3O4 NPs with different diameters for 24 hours. Cells incubated in medium only were used as control.
Abbreviation: NPs, nanoparticles.
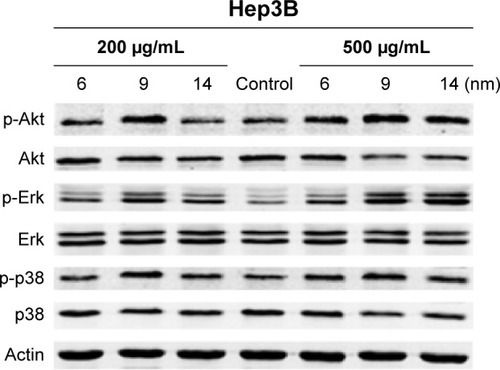
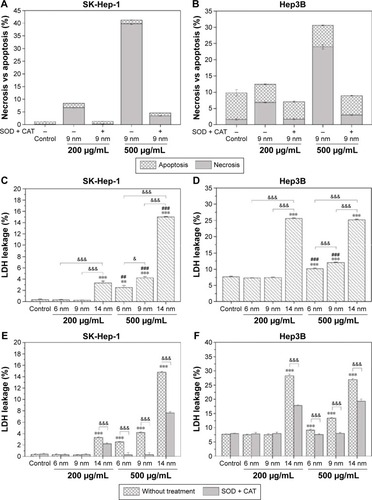
Figure 8 Influence of ROS scavenger on Fe3O4-induced necrosis and plasma membrane damage.
Notes: (A and B) ROS scavenger SOD and CAT suppressed Fe3O4 NPs-induced necrosis in human hepatoma SK-Hep-1 cells (A) and Hep3B cells (B). Cells exposed to Fe3O4 NPs with different diameters for 24 hours were determined by flow cytometry. Cells incubated in medium only were used as control. (C–F) Effect of Fe3O4 NPs on cellular membrane damage of human hepatoma SK-Hep-1 cells (C and E) and Hep3B cells (D and F). Cellular membrane damage of cells treated with different concentrations of Fe3O4 NPs with different diameters for 24 hours was measured by the LDH leakage assay. In some experiments, cells were incubated with SOD and CAT. Data are presented as mean ± SE of three independent experiments with triplicates in each case. **P<0.01, ***P<0.001 compared to the control without Fe3O4 NPs treatment; ##P<0.01, ###P<0.001 compared to the corresponding Fe3O4 NPs treatment at 200 µg/mL; &P<0.05, &&&P<0.001 between the indicated groups.
Abbreviations: CAT, catalase; LDH, lactate dehydrogenase; NPs, nanoparticles; ROS, reactive oxygen species; SE, standard error; SOD, superoxide dismutase.