Figures & data
Table 1 Mechanical properties of G/nHA/PA66 composites
Figure 1 SEM micrographs of nHA/PA66 (A) and G/nHA/PA66 (B) and XRD patterns (C). (Magnification 2000×).
Abbreviations: G/nHA/PA66, graphene/nanohydroxyapatite/polyamide66; SEM, scanning electron microscope; XRD, X-ray diffraction; nHA/PA66, nanohydroxyapatite/polyamide66.
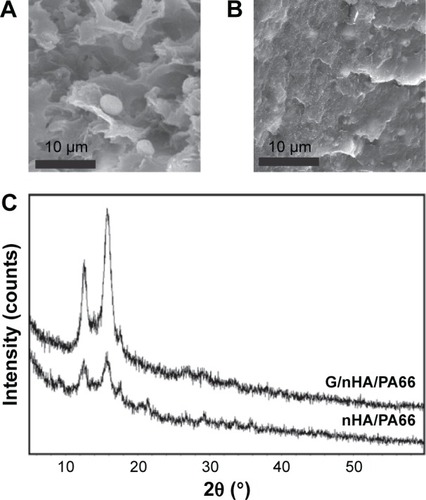
Figure 2 Cytotoxicity study of G/nHA/PA66 was performed by CCK-8 assay.
Note: *P<0.05 compared to the respective control (n=3).
Abbreviations: CCK-8, Cell Counting Kit-8; G/nHA/PA66, graphene/nanohydro-xyapatite/polyamide66; nHA/PA66, nanohydroxyapatite/polyamide66; OD, optical density.
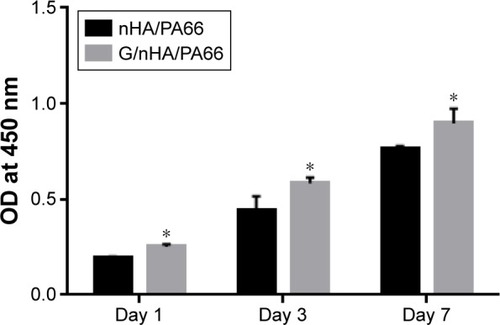
Figure 3 Confocal laser scanning microscope images of C3H10T1/2 cells cultured on nHA/PA66 (A–C) and G/nHA/PA66 (D–F) discs (scale bar =100 μm, magnification 200×).
Abbreviations: G/nHA/PA66, graphene/nanohydroxyapatite/polyamide66; nHA/PA66, nanohydroxyapatite/polyamide66.
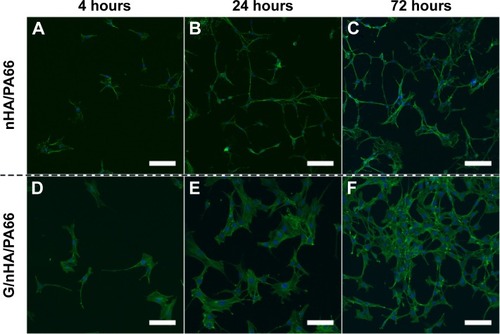
Figure 4 Alizarin red staining (A–D) and quantitative analysis (E).
Note: *P<0.05 compared to the respective control (scale bar =200 μm, magnification 200×) (n=5).
Abbreviations: G/nHA/PA66, graphene/nanohydroxyapatite/polyamide66; nHA/PA66, nanohydroxyapatite/polyamide66; OD, optical density.
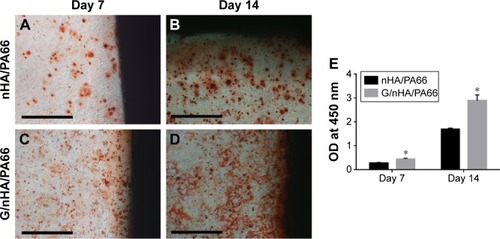
Figure 5 qRT-PCR analysis of the mRNA level of ALP and OC in C3H10T1/2 cells cultured for 7 (A) and 14 (B) days.
Note: *P<0.05 compared to the respective control (n=3).
Abbreviations: ALP, alkaline phosphatase; G/nHA/PA66, graphene/nanohydroxyapatite/polyamide66; mRNA, messenger RNA; nHA/PA66, nanohydroxyapatite/polyamide66; OC, osteocalcin; qRT-PCR, quantitative reverse transcription polymerase chain reaction.
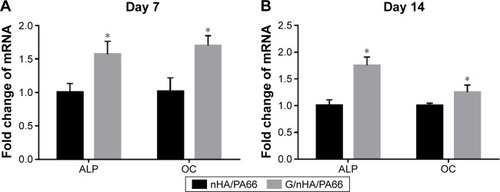
Figure 6 Gross histological analysis of liver (A), spleen (B), kidney (C), brain (D), and peri-implant tissue (E) 120 days after operation (scale bar =200 μm, magnification 100×).
Abbreviation: G/nHA/PA66, graphene/nanohydroxyapatite/polyamide66.
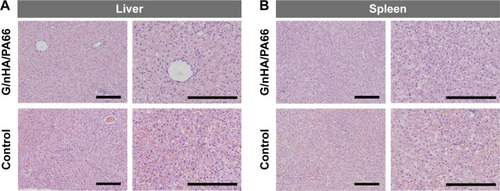
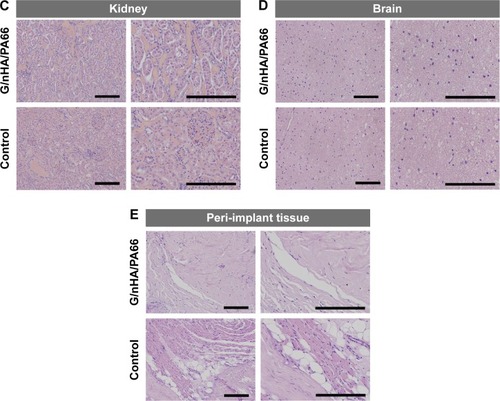
Figure 7 Histological observation of bone-implant interface for G/nHA/PA66 screws 7 (A, B) and 28 days (C, D) after operation (100×). The BIC was calculated (E).
Note: *P<0.05 compared to the respective control (n=4 specimens/group).
Abbreviations: BIC, bone-implant contact; G/nHA/PA66, graphene/nanohydroxyapatite/polyamide66.
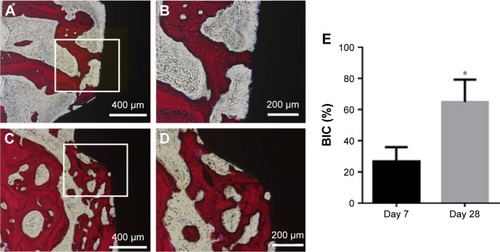
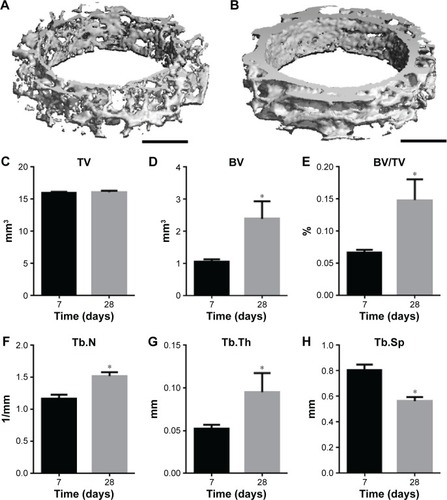
Figure 8 Micro-CT three-dimensional reconstruction of peri-implant bone with 1 mm with G/nHA/PA66 screws 7 (A) and 28 days (B) after operation. Peri-implant bone structural indices of G/nHA/PA66 materials (C–H).
Note: *P<0.05 compared to the respective control (n=5 specimens/group).
Abbreviations: BV, bone volume; BV/TV, bone volume/trabecular volume; G/nHA/PA66, graphene/nanohydroxyapatite/polyamide66; Tb.N, trabecular number; Tb.Th, trabecular thickness; Tb.Sp, trabecular separation; TV, trabecular volume; micro-CT, micro-computed tomography.