Figures & data
Figure 1 Morphological changes of CPV-infected cells. Differential interference contrast microscopy pictures of mock- and CPV-infected cells. (a) NLFK cells at 12 hours, 24 hours, and 48 hours post infection. (b) A72 cells at 24 hours, 48 hours, and 72 hours post infection. Arrowheads point to rounded cells. Bars 10 μm.
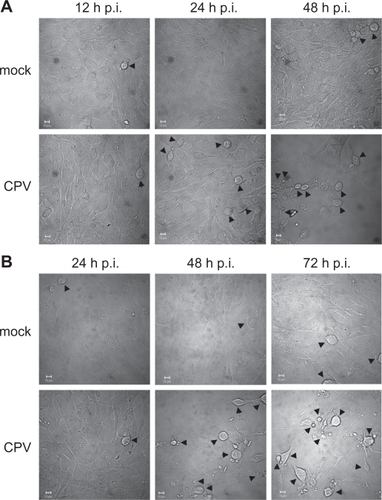
Figure 2 Induction of cell cycle arrest. Flow cytometric analysis showing the DNA histograms of PI-stained mock- and CPV-infected NLFK and A72 cells at indicated time points post infection. Percentage of cell population in each cell cycle phase is given. (a) Mock- (24 hours post infection) and CPV-infected (12 hours, 16 hours, and 24 hours post infection) NLFK cells. (b) Mock- (72 hours post infection) and CPV-infected (24 hours, 48 hours, and 72 hours post infection) A72 cells.
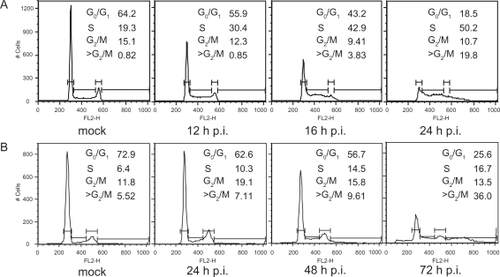
Figure 3 Flow cytometry analysis of annexin V- (FL1-H) and PI- (FL2-H) labeled cells. STS (0.5 μM 16 hours) was used as a positive control to induce apoptosis. Percentage of cells within each quadrant are indicated. (a) Cytograms of mock- (23 hours post-infection) and CPV-infected (12 hours, 15 hours, 17 hours, and 23 hours post-infection) NLFK cells. (b) Cytograms of mock- (72 hours post-infection) and CPV-infected (24 hours, 48 hours, and 72 hours post-infection) A72 cells.
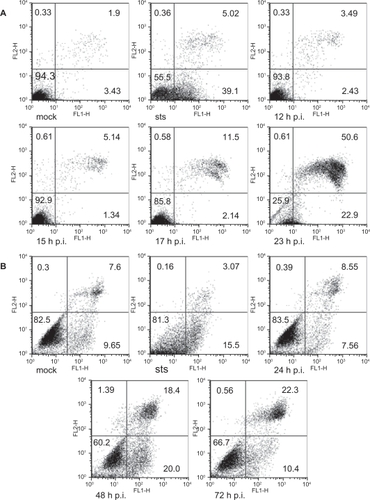
Figure 4 Caspase 3/7, caspase 8, and caspase 9 activation in CPV-infected cells. (a) Mock- (24 hours post-infection) and CPV- (6 hours, 12 hours, 18 hours, 24 hours, and 48 hours post-infection) infected NLFK cells. (b) Mock- (24 hours post-infection) and CPV- (12 hours, 24 hours, 48 hours, and 72 hours post-infection) infected A72 cells.
Notes: STS (1.0 μM 12 hours) was used as a positive control to induce apoptosis. Results from individual tests were normalized and averages were counted from triplicate results. Statistical significance is marked with *(P < 0.05).
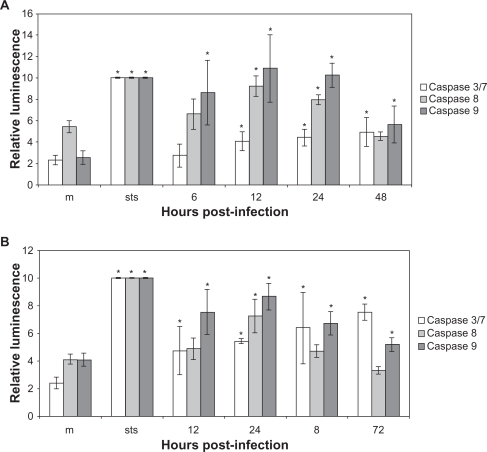
Figure 5 Biochemical and molecular changes in CPV-infected NLFK cells. (a) Phosphorylation of histone H2A.X. CPV-infected cells were fixed at different time points post infection and labeled with anti-phospho-histone H2A.X and anti-NS1 antibodies (a marker of virus protein expression). Percentage of H2A.X and NS1 positive cells were calculated (n = 1,000). m = mock-infected cells 24 hours post infection. Error bars indicate standard deviations. (b) and (c) Condensation and fragmentation of the nucleus and DNA during infection. (b) Transmission electron microscopy pictures of mock-infected (48 hours post-infection) and CPV-infected nucleus at 24 hours postinfection and 48 hours post-infection. Bars 1 μm. Arrows show nuclear membrane blebbing. (c) Agarose gel electrophoresis showing fragmentation of DNA in infected cells. Lane 1: mock-infected cells 48 hours post-infection, Lane 2: 24 hours post-infection, Lane 3: 48 hours post-infection.
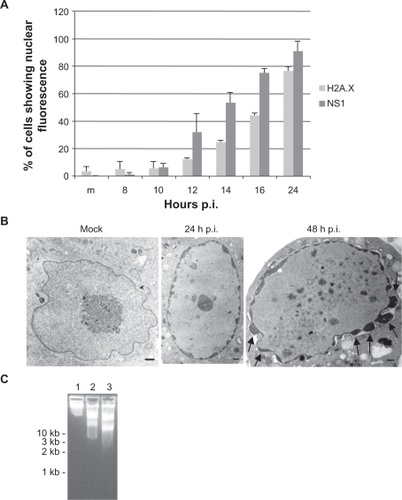
Figure 6 Depolarization of plasma membrane and mitochondrial membrane potential during CPV infection. (a) Mock- (23 hours post infection) and CPV-infected (17 hours and 23 hours post infection) cells were labeled with DiOC6(3) and analyzed with flow cytometer. (b) Flow cytometry scatter diagrams of mock- (24 hours post infection) and CPV-infected (18 hours and 24 hours post infection) cells labeled with DePsipher. Percentage of cells within in each quadrant are indicated.
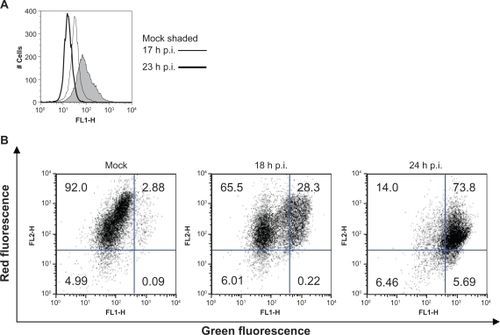
Table 1 CPV infection of human tumor cell lines