
Figures & data
Table 1 Physiochemical characterization of Cu NPs
Figure 1 Morphology and size distribution of Cu NPs.
Notes: (A and B) TEM and (C and D) SEM images of Cu NPs. Size distribution of (E) actual size and (F) hydrodynamic size of Cu NPs (in deionized water, pH 7.8) is determined by TEM and DLS methods, respectively.
Abbreviations: Cu NPs, copper nanoparticles; DLS, dynamic light scattering; SEM, scanning electron microscopy; TEM, transmission electron microscopy.
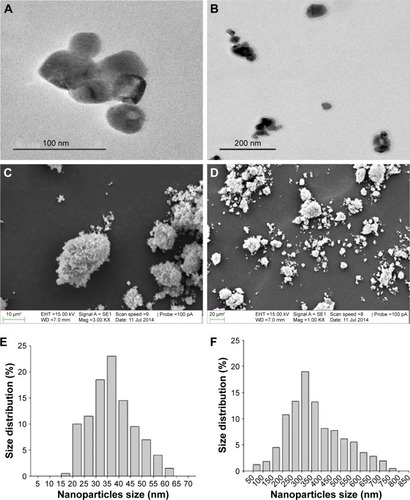
Figure 2 Dissolution of Cu NPs in biological conditions and systemic absorption of Cu from Cu NPs and Cu ions.
Notes: (A) Dissolution ratios of Cu NPs and Cu ions in artificial gastric fluid (pH 1.5), vehicle (pH 6.5), and deionized water (pH 7.8) conditions, which simulated in vivo physiological conditions. Percentage of dissolution measured using ICP-MS after 24 hours incubation. (B) Absorption of Cu from Cu NP- and Cu ion-treated rats is measured at 0 hour (control), 12 hours, 24 hours, 48 hours, 72 hours, 1 week, 2 weeks, and 4 weeks after a single oral dose of 500 mg/kg each. Values are presented as mean ± SD (n=3). *P<0.05, **P<0.01 vs vehicle control. Cu ions, copper(II) chloride.
Abbreviations: AGF, artificial gastric fluid; DW, deionized water; Cu NPs, copper nanoparticles; HPMC, hydroxypropylmethylcellulose; ICP-MS, inductively coupled plasma mass spectrometry; SD, standard deviation.
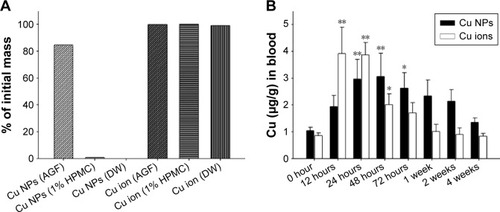
Figure 3 Biodistribution of Cu from Cu NPs and Cu ions.
Notes: Cu levels in (A) liver, (B) kidney, (C) spleen, (D) heart, (E) lung, and (F) brain in the Cu NP- and Cu ion-treated rats are determined at 0 hour (control), 12 hours, 24 hours, 48 hours, 72 hours, 1 week, 2 weeks, and 4 weeks after a single oral dose of 500 mg/kg each. Values are presented as mean ± SD (n=3). *P<0.05, **P<0.01 vs vehicle control. Cu ions, copper(II) chloride.
Abbreviations: Cu NPs, copper nanoparticles; SD, standard deviation.
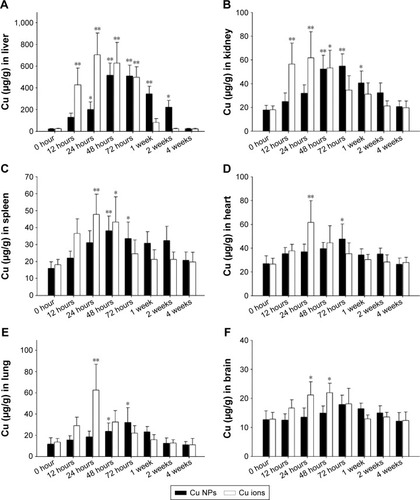
Figure 4 Excretion of Cu from Cu NPs and Cu ions.
Notes: Cu levels in (A) urine and (B) feces of Cu NP- and Cu ion-treated rats are measured at 0 hour (control), 12 hours, 24 hours, 48 hours, 72 hours, 1 week, 2 weeks, and 4 weeks after a single oral dose of 500 mg/kg each. Values are presented as mean ± SD (n=3). *P<0.05, **P<0.01 vs vehicle control. Cu ions, copper(II) chloride.
Abbreviations: Cu NPs, copper nanoparticles; SD, standard deviation.
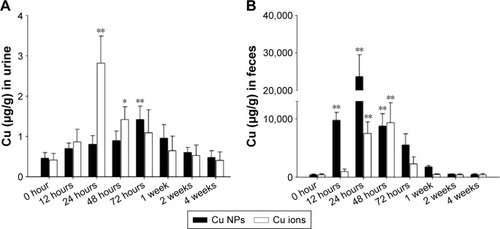
Figure 5 Mortality and body weight changes of Cu NP- and Cu ion-treated rats.
Notes: (A and B) Survival rate and (E and F) body weight changes of male and female rats, respectively, treated with single oral dose of Cu NPs (312–2,500 mg/kg). (C and D) Survival rate and (G and H) body weight changes of male and female rats, respectively, treated with Cu ions (156–1,250 mg/kg). Values are presented as mean ± SD. *P<0.05, **P<0.01 vs vehicle control. Cu ions, copper(II) chloride.
Abbreviations: Cu NPs, copper nanoparticles; LD50, median lethal dose; SD, standard deviation.
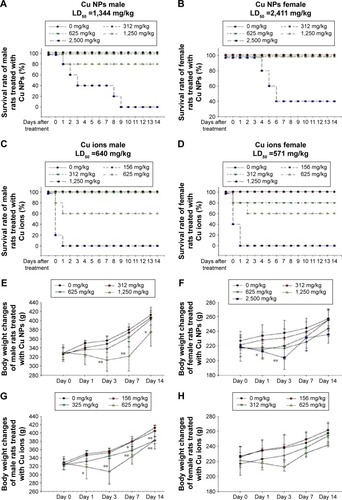
Figure 6 Histopathological results from the liver, kidney, and spleen of rats treated with Cu NPs and Cu ions.
Notes: The liver from rats treated with Cu NPs (males for 1,250 mg/kg and females for 2,500 mg/kg) shows mild inflammatory cell infiltration (closed arrows), vacuolation (open arrows), and sinusoid dilation (open arrowheads). The rats treated with Cu ions show similar histopathological alterations at 625 mg/kg in both sexes (×200). The histological changes of kidneys from rats treated with Cu NPs include inflammatory cell infiltration (closed arrows), hyaline cast (closed arrowheads) and cell debris (asterisks) in tubules, dilated tubules (open arrowheads), and atrophy of glomeruli (open arrows). Kidneys treated with Cu ions exhibit mild dilated tubules and cast in tubules (cortex, ×100; medulla, ×200). The spleen of rats treated with Cu NPs shows mild decrease in cellularity in white pulp and increase in multinucleated giant cells (megakaryocytes; open arrows). Spleen of rats treated with Cu ions has no histological changes (×100). Hematoxylin and eosin stain. Scale bar =50 µm. Cu ions, copper(II) chloride.
Abbreviation: Cu NPs, copper nanoparticles.
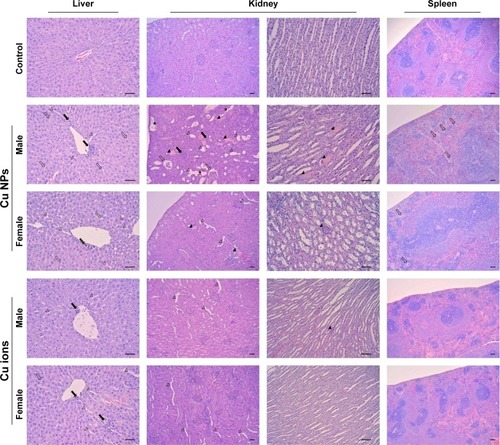
Figure 7 Serum biochemical changes of Cu NP-treated rats at dose levels of 0 mg/kg, 312 mg/kg, 625 mg/kg, 1,250 mg/kg, and 2,500 mg/kg.
Notes: The bar graphs present serum biochemical changes of Cu NP (A–O)-treated male and female rats. Values are presented as mean ± SD. *P<0.05, **P<0.01 vs vehicle control.
Abbreviations: ALB, albumin; ALP, alkaline phosphatase; ALT, alanine aminotransferase; AST, aspartate aminotransferase; BUN, blood urea nitrogen; CPK, creatine phosphokinase; CRE, creatinine; Cu NPs, copper nanoparticles; LDH, lactate dehydrogenase; TBIL, total bilirubin; TCHO, total cholesterol; TG, triglyceride; TP, total protein; SD, standard deviation.
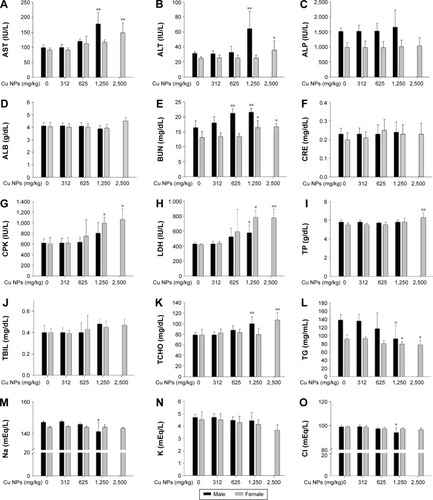
Figure 8 Serum biochemical changes of Cu ion-treated rats at dose levels of 0 mg/kg, 156 mg/kg, 312 mg/kg, and 625 mg/kg.
Notes: The bar graphs show serum biochemical changes of Cu ion (A–O)-treated male and female rats. Values are presented as mean ± SD. *P<0.05, **P<0.01 vs vehicle control. Cu ions, copper(II) chloride.
Abbreviations: ALB, albumin; ALP, alkaline phosphatase; ALT, alanine aminotransferase; AST, aspartate aminotransferase; BUN, blood urea nitrogen; CPK, creatine phosphokinase; CRE, creatinine; LDH, lactate dehydrogenase; TBIL, total bilirubin; TCHO, total cholesterol; TG, triglyceride; TP, total protein; SD, standard deviation.
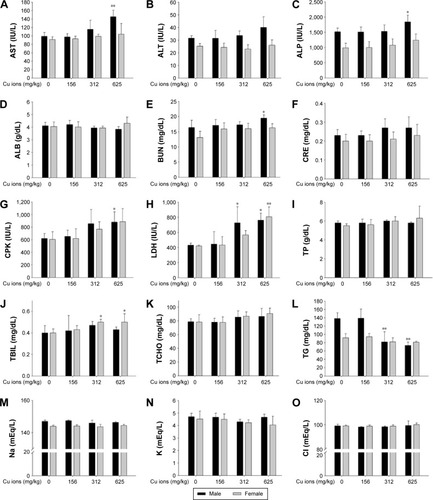
Table S1 Absolute and relative organ weights in rats treated with Cu NPs
Table S2 Absolute and relative organ weights in rats treated with Cu ions