
Figures & data
Table 1 Independent variables and their coded levels in the Box–Behnken design
Table 2 Dependent variables and their constraints in the Box–Behnken design
Table 3 Optimum concentration of independent variables for desired formulation with predicted responses and error
Figure 1 Characterization of NLA.
Notes: (A) Size distribution and (B) zeta potential by dynamic light scattering technique, (C) morphology by atomic force microscopy at a scale bar of 1 µm and (D) transmission electron microscopy at a scale bar of 100 nm, and (E) cumulative drug release for 48 hours at pH 5.5 and pH 7.4. All experiments were done in triplicate.
Abbreviation: NLA, nanoliposomal artemisinin.
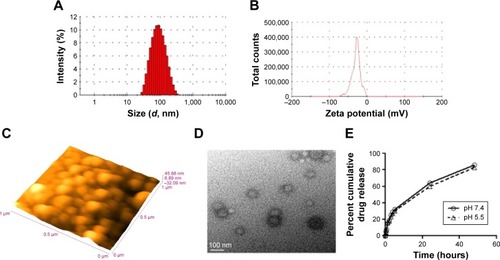
Figure 2 Toxicity of NLA.
Notes: (A) Ex vivo on murine macrophages by MTT assay after 72 hours incubation at a concentration range of 0.82–200 µg/mL. Serum levels of (B) AST and ALT, (C) ALP, (D) creatinine, and (E) urea in healthy animals after 24 hours of administration of artemisinin, NLA, ENL, and AmB at the highest dose. Data are represented as mean ± SD and are from one of the two independent experiments. ***P<0.0001.
Abbreviations: ALP, alkaline phosphatase; ALT, alanine transaminase; AmB, amphotericin B; AST, aspartate aminotransaminase; ENL, empty nanoliposome; NLA, nanoliposomal artemisinin.
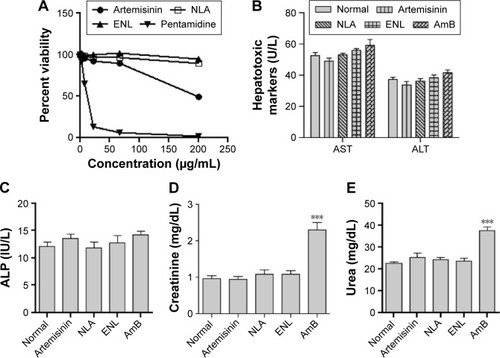
Figure 3 In vitro antileishmanial activity.
Notes: (A) Giemsa-stained murine macrophages infected with Leishmania donovani parasites at 48 hours in untreated and treated conditions. (B) Percent L. donovani amastigote infection and (C) percent macrophages infected with L. donovani amastigotes at 48 hours after incubation with different concentrations of artemisinin, NLA, and pentamidine (0–50 µg/mL). (D) Nitric oxide levels in the culture supernatant of uninfected, infected, and treated samples at 48 hours by Griess assay. **P<0.001, ***P<0.0001
Abbreviations: NLA, nanoliposomal artemisinin; ns, not significant.
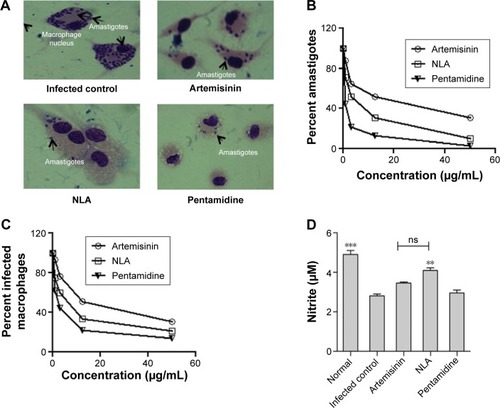
Figure 4 Antileishmanial activity of nanoliposomes in experimental VL.
Notes: (A) Spleen and liver weight in normal, infected, and treated animals 1 week post-treatment. (B) Percentage inhibition of parasites in the spleen and liver 1 week post-treatment. Data are represented as mean ± SD from one of the two independent experiments having five animals per group. *P<0.05, **P<0.001, ***P<0.0001.
Abbreviations: AmB, amphotericin B; ENL, empty nanoliposome; NLA, nanoliposomal artemisinin; VL, visceral leishmaniasis.
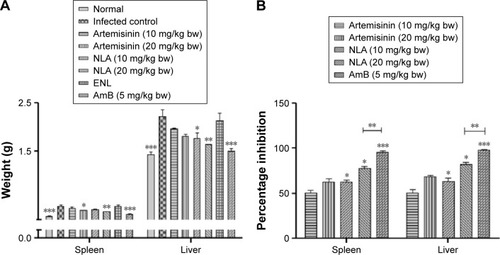
Figure 5 Evaluation of cellular immunity.
Notes: (A) Delayed type hypersensitivity response to freeze thawed leishmanial antigen (800 µg/mL) after 24 hours in age-matched, infected control and animals treated with artemisinin, NLA, ENL, and AmB at the highest dose. (B) Proliferative response by CFSE after 72 hours of in vitro stimulation of total lymphocytes with SLA (10 µg/mL) at the highest dose of artemisinin, NLA, ENL, and AmB. (C) Induction of IL-4, (D) IFN-γ, and (E) IL-10 in the culture supernatant of splenocytes at 72 hours by cytokine bead array at the highest dose of artemisinin, NLA, ENL, and AmB. (F) Parasite-specific antibodies IgG1 and IgG2a 1 week posttreatment with artemisinin, NLA, ENL, and AmB at the highest dose measured by ELISA. Data are represented as mean ± SE from one of the two independent groups having five animals per group. *P<0.05, **P<0.001, ***P<0.0001.
Abbreviations: AmB, amphotericin B; CFSE, carboxy fluorescein succinidimyl ester; ELISA, enzyme-linked immunosorbent assay; ENL, empty nanoliposome; FT, freeze thawed; IFN-γ, interferon-γ; IgG, immunoglobulin G; IL, interleukin; NLA, nanoliposomal artemisinin; SLA, soluble leishmanial antigen.
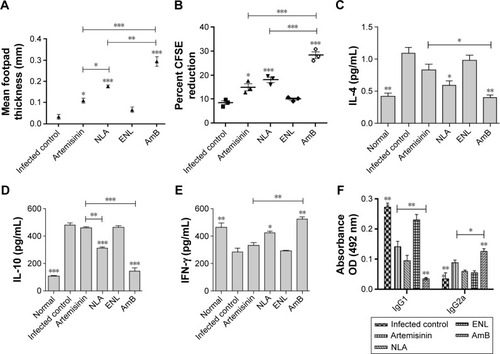
Figure S1 Box–Behnken or response surface plots showing the effect of independent factors on dependent factors.
Notes: (A) Effect of drug/PC and cholesterol. (B) Drug/PC and sonication time and (C) cholesterol and sonication time on particle size. Particle size is an important parameter or variable for the development of a drug delivery system. EquationEquation 7(7) suggests dependence of particle size on independent factors. Negative sign indicates a decrease in the particle size, whereas positive sign in the equation represents an increase in the particle size. An increase in the drug/PC has an unfavorable effect on the particle size and similarly amount of cholesterol directly influences and increases the particle size of the nanoliposomes, while the interaction terms do not have any significant effect. (D) Effect of drug/PC and cholesterol, (E) drug/PC and sonication time, and (F) cholesterol and sonication time on PDI. From the polynomial equation (EquationEquation 8
(8) ), positive sign indicates synergistic effect, whereas negative sign represents antagonistic effect. Higher value of PDI suggests nonuniform size distribution of nanoliposomes that may lead to aggregation and hence compromises the stability of nanoparticles. (G) Effect of drug/PC and cholesterol, (H) drug/PC and sonication time, and (I) cholesterol and sonication time on zeta potential. From EquationEquation 9
(9) , it is clear as the levels of cholesterol, sonication time, and interaction terms AC, ie, drug/PC and sonication time, have an inverse relationship with zeta potential. (J) Effect of drug/PC and cholesterol, (K) drug/PC and sonication time, and (L) cholesterol and sonication time on drug loading. The relationship or effect of independent variable on drug loading is shown in the equation and Box–Behnken plots generated, indicating the effect of independent variables on particle size, PDI, zeta potential, and drug loading that are given in (J–L). It is clear from the above equation and response surface plots that drug/PC, amount of cholesterol, and sonication time in the formulation had a significant positive effect on the drug loading, ie, an increase in the levels of these constituents at a time directly influences the amount of drug loading.
Abbreviations: PC, phosphatidylcholine; PDI, polydispersity index.
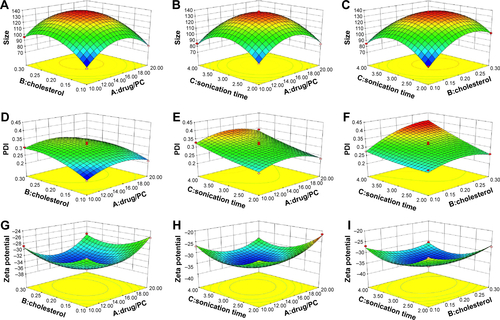
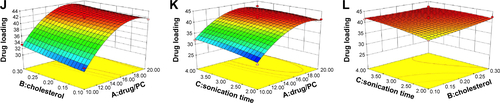
Figure S2 Contour plots representing percent proliferation of splenocytes after 72 hours of in vitro recall with SLA.
Abbreviations: AmB, amphotericin B; CFSE, carboxy fluorescein succinidimyl ester; ENL, empty nanoliposome; NLA, nanoliposomal artemisinin; SLA, soluble leishmanial antigen; SSC, side scatter.
Table S1 Experimental design generated by Design Expert® 8.0.7.1 consisting of 17 combinations including five replicates at the central level
Table S2 Responses in dependent variables (particle size, PDI, zeta potential, and drug loading after experimental run)
Table S3 Summary of results of model analysis, lack of fit, R2 analysis for measured response
Table S4 Storage stability at different time points at 37°C for 25 days
Table S5 Mechanism of drug release under in vitro conditions at endosomal and physiological pH at 37°C
Table S6 IC50 values of NLA and artemisinin in an ex vivo model of leishmaniaisis