Figures & data
Figure 1 Schematic diagram of the work.
Abbreviations: MRI, magnetic resonance imaging; PDT, photodynamic therapy; SPIONs, superparamagnetic iron oxide nanoparticles.
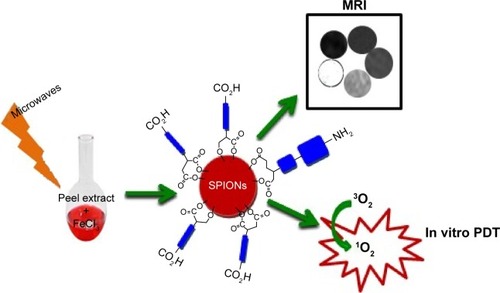
Figure 2 Structural and optical characterization of SPIONs.
Notes: (A) XRD patterns of the samples, (B) Rutherford backscattering spectra, and (C, D) diffuse reflectance spectra showing the composition and bandgap energies of the synthesized bio-SPIONs.
Abbreviations: AP-SPIONs, apple peel-mediated SPIONs; LP-SPIONs, lemon peel-mediated SPIONs; OP-SPIONs, orange peel-mediated SPIONs; PP-SPIONs, pomegranate peel-mediated SPIONs; SPIONs, superparamagnetic iron oxide nanoparticles; XRD, X-ray diffraction.
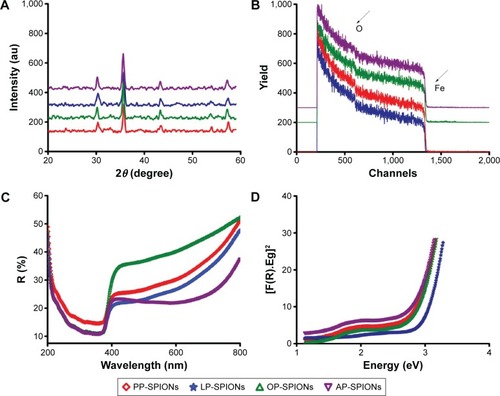
Figure 3 Fluorescence spectra, magnetization response and FTIR spectra.
Notes: (A) Fluorescence emission spectra where λex =270 nm and (B) magnetization curve of bio-SPIONs. FTIR spectra of (C) PEG-SPIONs and (D) SA-SPIONs functionalized through MW incubation.
Abbreviations: AP-SPIONs, apple peel-mediated SPIONs; FTIR, fourier transform infrared; LP-SPIONs, lemon peel-mediated SPIONs; MW, microwave; OP-SPIONs, orange peel-mediated SPIONs; PEG, polyethylene glycol; PP-SPIONs, pomegranate peel-mediated SPIONs; SA, succinic anhydride; SPIONs, superparamagnetic iron oxide nanoparticles.
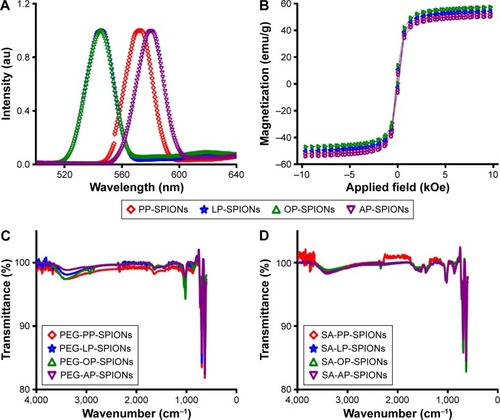
Figure 4 FESEM images of (A) PEG-PP-SPIONs, (B) PEG-LP-SPIONs, (C) PEG-LP-SPIONs, and (D) PEG-LP-IONPs functionalized through MW incubation.
Note: Transparent thin shell surrounding the NPs indicates successful PEGylation.
Abbreviations: FESEM, field emission scanning electron microscopy; IONP, iron oxide nanoparticles; LP-SPIONs, lemon peel-mediated SPIONs; MW, microwave; NPs, nanoparticles; PEG, polyethylene glycol; PP-SPIONs, pomegranate peel-mediated SPIONs; SPIONs, superparamagnetic iron oxide nanoparticles.
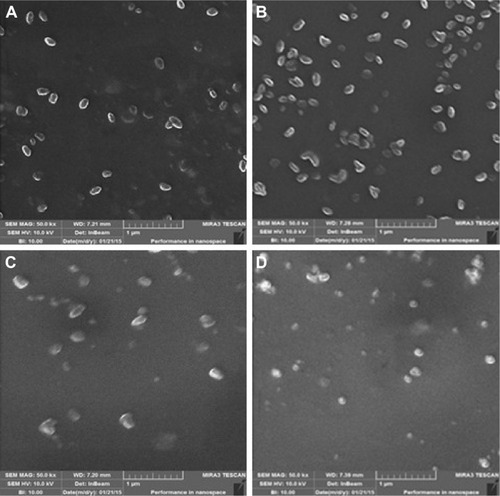
Figure 5 AFM images of (A) SA-PP-SPIONs, (B) SA-OP-SPIONs, (C) SA-AP-SPIONs, and (D) SA-LP-SPIONs functionalized through MW incubation.
Abbreviations: AFM, atomic force microscopy; AP-SPIONs, apple peel-mediated SPIONs; LP-SPIONs, lemon peel-mediated SPIONs; MW, microwave; OP-SPIONs, orange peel-mediated SPIONs; PP-SPIONs, pomegranate peel-mediated SPIONs; SA, succinic anhydride; SPIONs, superparamagnetic iron oxide nanoparticles.
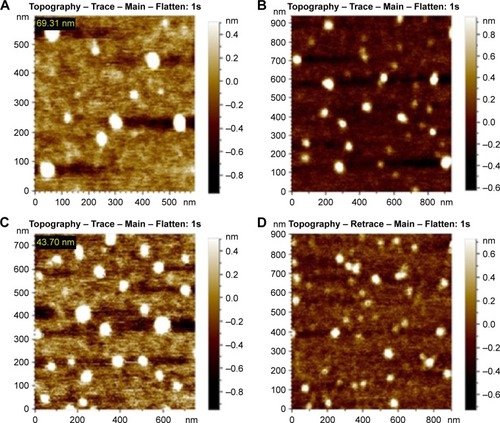
Figure 6 MR studies of SPIONs.
Notes: (A) T2-weighted images of cell suspensions with different metal ion (Fe in millimoles) concentrations at 1.5 T. (B) Linear fitting of 1/T2 as a function of Fe concentration. (C) MR transverse relaxivity (R2) values of PEG-SPIONs functionalized through MW incubation.
Abbreviations: AP-SPIONs, apple peel-mediated SPIONs; LP-SPIONs, lemon peel-mediated SPIONs; MR, magnetic resonance; MW, microwave; OP-SPIONs, orange peel-mediated SPIONs; PEG, polyethylene glycol; PP-SPIONs, pomegranate peel-mediated SPIONs; SPIONs, superparamagnetic iron oxide nanoparticles.
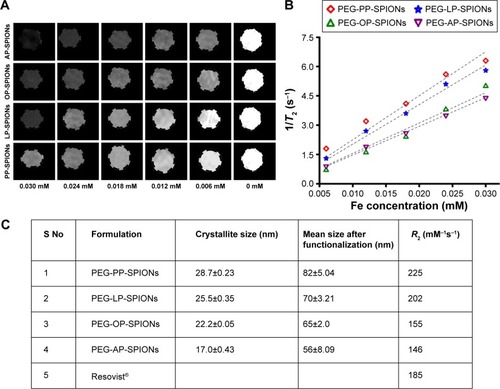
Figure 7 Biocompatibility of SPIONs.
Notes: (A) Hemolysis results of bio-SPIONs. Relative cell viability curves of (B) bio-SPIONs, (C) PEG-SPIONs, and (D) SA-SPIONs functionalized through MW incubation. Percentage viabilities (mean ± SD) were calculated (P<0.05; two-tailed t-test).
Abbreviations: AP-SPIONs, apple peel-mediated SPIONs; LP-SPIONs, lemon peel-mediated SPIONs; OP-SPIONs, orange peel-mediated SPIONs; NTC, nontreated cell; PP-SPIONs, pomegranate peel-mediated SPIONs; PEG, polyethylene glycol; SA, succinic anhydride; SPIONs, superparamagnetic iron oxide nanoparticles; SD, standard deviation; PC, positive control.
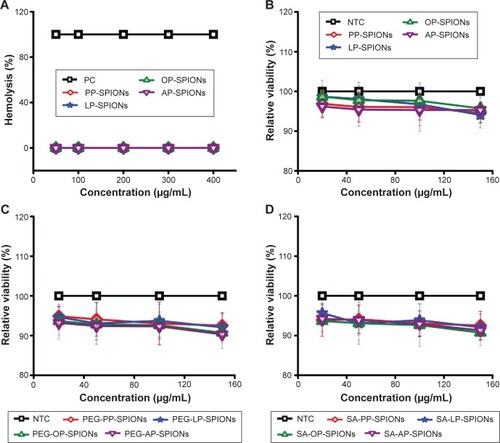
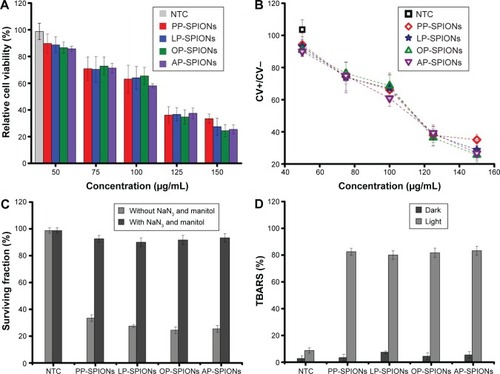
Figure 8 Photo-toxicity studies.
Notes: (A) PDT effects of bio-SPIONs on HeLa cell viability. (B) Cell viability ratios in light and dark reactions (CV+/CV−) vs concentration. (C) Changes in the surviving fractions of the treated HeLa cells preincubated with and without the scavengers (NaN3 and mannitol). (D) TBA assay results for SPION exposure. Data are expressed as percentage (mean ± SD) relative to the NTC sample (P<0.05; two-tailed t-test).
Abbreviations: AP-SPIONs, apple peel-mediated SPIONs; CV, cell viability; HeLa, human cervical epithelial malignant carcinoma; LP-SPIONs, lemon peel-mediated SPIONs; NTC, nontreated cell; OP-SPIONs, orange peel-mediated SPIONs; PDT, photodynamic therapy; PP-SPIONs, pomegranate peel-mediated SPIONs; SPION, superparamagnetic iron oxide nanoparticle; TBA, thiobarbituric acid; TBARS, TBA-reactive substances; SD, standard deviation.