Figures & data
Table 1 Hydrodynamic diameters and zeta potentials of NiONPs in different media
Figure 1 NiONP characterization.
Notes: The primary sizes and morphologies of the NiONPs were characterized by high-resolution TEM, and a representative image is shown. Scale bar: 50 nm.
Abbreviations: NiONP, nickel oxide nanoparticle; TEM, transmission electron microscopy.
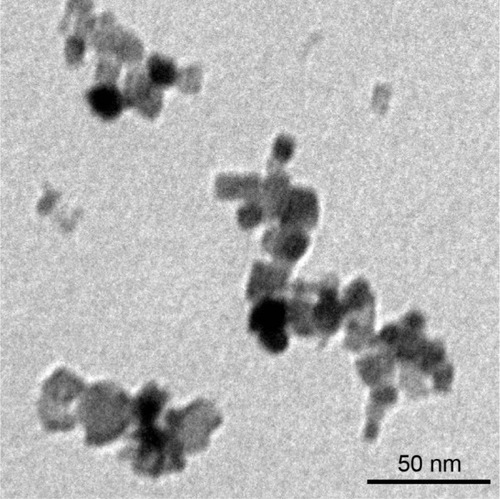
Figure 2 Intratracheal instillation of NiONPs induces pulmonary inflammation in rats.
Notes: (A) Total cell numbers; (B) neutrophil numbers; (C) macrophage numbers; and (D) ALP, (E) LDH, and (F) total protein concentrations in BALF were determined at 3 days, 7 days, and 28 days postexposure. (G, H) MPO, a marker of neutrophils, was measured by Western blotting. (I) MPO activity in lung tissues was measured using an MPO Assay Kit. (J) Lung histopathology at 3 days, 7 days, and 28 days after treatment with saline or NiONPs. Representative figures for four individuals from each group are shown. Scale bar sizes are indicated. The values are mean ± SEM (n=6). Significance vs vehicle control is indicated by *P<0.05 and **P<0.01. Black arrows indicate inflammatory foci.
Abbreviations: ALP, alkaline phosphatase; BALF, bronchoalveolar lavage fluid; LDH, lactate dehydrogenase; MPO, myeloperoxidase; NiONP, nickel oxide nanoparticle; SEM, standard error of the mean.
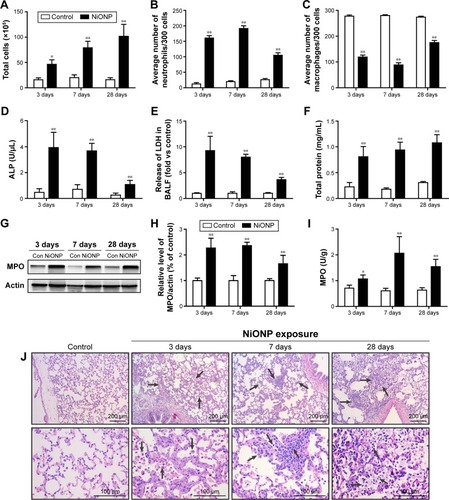
Figure 3 NiONPs induce NLRP3 inflammasome activation and cytokine release in vivo.
Notes: IL-1β (A) and IL-18 (B) were measured in BALF supernatants (n=4). After exposure, AMs were isolated and cultured, and the inflammatory responses were detected by real-time PCR (C, D). Nlrp3, pro-caspase-1 (p45), caspase-1 (p20), and IL-1β were detected by Western blotting (E), and the fold changes were quantified (F–I). Immunohistochemical analysis of NLRP3 expression in vehicle control vs NiONP-treated rats at 3 days, 7 days, and 28 days after exposure (J). The results are expressed as a percentage of the vehicle control group, which is set at 100%. The values are presented as mean ± SEM; *P<0.05 and **P<0.01 vs the vehicle control group.
Abbreviations: AM, alveolar macrophage; BALF, bronchoalveolar lavage fluid; IL, interleukin; NiONP, nickel oxide nanoparticle; PCR, polymerase chain reaction; SEM, standard error of the mean.
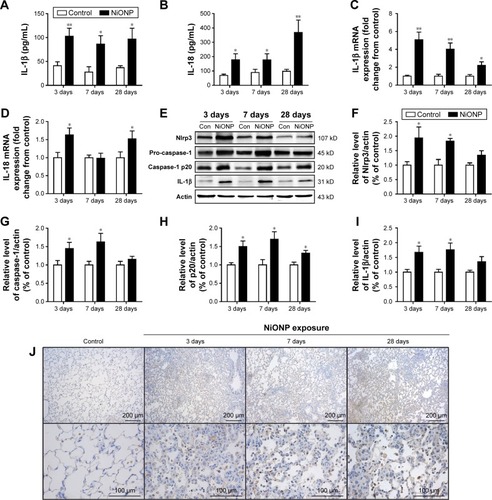
Figure 4 NiONPs induce cytotoxicity and cytokine secretion in RAW264.7 cells.
Notes: (A) Newport Green fluorescence indicating intracellular ionic nickel after 12 hours of exposure to NiONPs. (B, C) Cell viabilities were determined using a CCK-8 Proliferation Assay Kit. (D–G) IL-1β and TNF-α release into the culture supernatants of untreated or LPS-primed mouse macrophages stimulated with NiONPs. (H, I) IL-1β and TNF-α mRNA levels in untreated or LPS-primed mouse macrophages stimulated with NiONPs. Data are representative of at least three independent experiments and are expressed as a percentage of the control, which was set at 100%. The values are mean ± SEM; *P<0.05 vs the control group, **P<0.01 vs the control group, and #P<0.05 in comparison with the respective unprimed mouse macrophages.
Abbreviations: CCK-8, Cell Counting Kit-8; IL, interleukin; LPS, lipopolysaccharides; NiONP, nickel oxide nanoparticle; SEM, standard error of the mean; TNF-α, tumor necrosis factor-α.
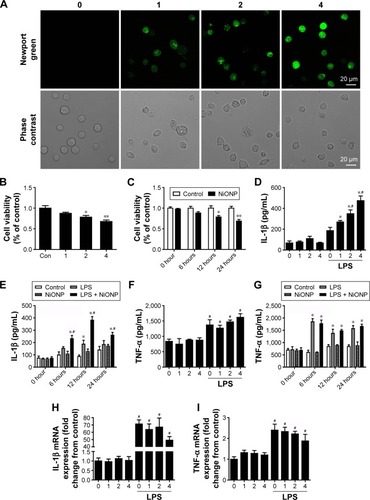
Figure 5 NiONPs induce caspase-1-dependent cytokine secretion in RAW264.7 cells.
Notes: (A–C) The pro-caspase-1 and pro-IL-1β levels in cell lysates (input) and processed caspase-1 and IL-1β levels in culture SNs after treatment with different doses (0 µg/cm2, 1 µg/cm2, 2 µg/cm2, and 4 µg/cm2) of NiONPs were analyzed by Western blotting. (D) Caspase-1 activity in RAW264.7 cells. (E) Detection of IL-1β expression in the SN by ELISA. *P<0.05 vs the control group, and #P<0.05 in comparison with the respective unprimed macrophages. (F–I) The pro-caspase-1, pro-IL-1β, and processed caspase-1 and IL-1β expression levels, (J) caspase-1 activity, and (K) IL-1β release in mouse macrophages stimulated (or not) with NiONPs in the presence (or not) of z-yvad-fmk. Data are presented as mean ± SEM from three independent experiments. *P<0.05, **P<0.01 vs the control group, and #P<0.05 in comparison with the respective unprimed macrophages.
Abbreviations: ELISA, enzyme-linked immunosorbent assay; IL, interleukin; LPS, lipopolysaccharides; NiONP, nickel oxide nanoparticle; SEM, standard error of the mean; SNs, supernatants.
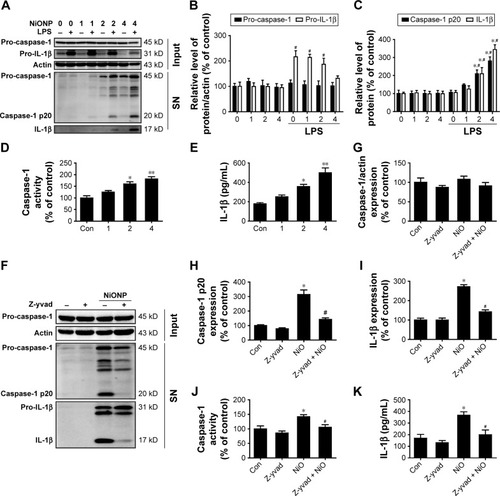
Figure 6 Nlrp3 siRNA blocks NLRP3 inflammasome activation and IL-1β release induced by NiONPs.
Notes: (A–C) Nlrp3 mRNA and protein expression in LPS-primed macrophages transfected with either control siRNA or Nlrp3 siRNA and stimulated (or not) with NiONPs. (D, E) The processed caspase-1 and IL-1β levels in culture SN and (F) caspase-1 activity were determined. (G) IL-1β release in culture SN of LPS-primed macrophages transfected with either control siRNA or Nlrp3 siRNA stimulated (or not) with NiONPs. *P<0.05 compared with the control siRNA group, and #P<0.05 compared with the NiONP group.
Abbreviations: IL, interleukin; LPS, lipopolysaccharides; NiONP, nickel oxide nanoparticle; SN, supernatant.
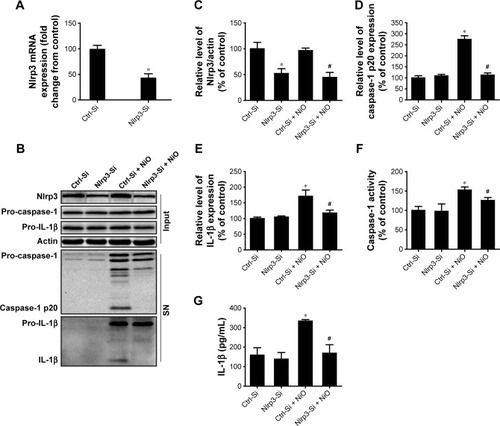
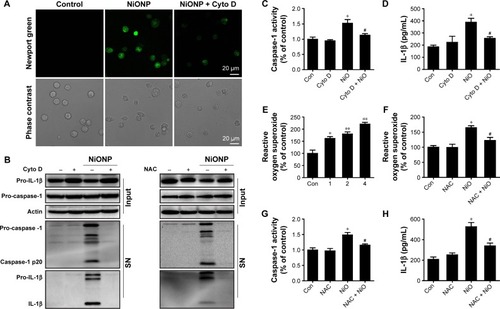
Figure 7 NiONP-induced NLRP3 inflammasome activation requires phagocytosis and ROS production.
Notes: (A) Newport Green fluorescence indicating intracellular ionic nickel after 12 hours of exposure to NiONPs. (B) The pro-caspase-1, pro-IL-1β, and processed caspase-1 and IL-1β expression levels, (C, G) caspase-1 activity, (D, H) IL-1β release, and (E, F) ROS production in macrophages stimulated (or not) with NiONPs in the presence (or not) of cytochalasin D or NAC. Data are presented as mean ± SEM from three independent experiments and are expressed as a percentage of the control, which was set at 100%. **P<0.01, *P<0.05 compared with the control group, and #P<0.05 compared with the NiONP group.
Abbreviations: IL, interleukin; NAC, N-acetylcysteine; NiONP, nickel oxide nanoparticle; ROS, reactive oxygen species; SEM, standard error of the mean; SN, supernatant.